PredictionsNewsMock2008 Mock Presidential ElectionResultsForumPolls
Note: The Google advertisement links below may advocate political positions that this site does not endorse.

Total Results - U.S. National

  Presidential
Candidate
Vice Presidential
Candidate
Political Party Popular Vote EV
ptyJohn McCainSarah Palin Republican900 58.06% 457 84.9%
ptyBarack ObamaJoseph Biden Democratic484 31.23% 81 15.1%
ptyCynthia McKinneyRosa Clemente Green53 3.42% 0 0.0%
ptyBob BarrWayne Allyn Root Libertarian43 2.77% 0 0.0%
ptyChuck BaldwinDarrell Castle Constitution16 1.03% 0 0.0%
ptyRalph NaderMatt Gonzalez Independent15 0.97% 0 0.0%
ptyMitt RomneyFred Thompson Independent Conservative11 0.71% 0 0.0%
ptyBrian MooreStewart Alexander Socialist5 0.32% 0 0.0%
ptyCharles JayTom Knapp Boston Tea Party3 0.19% 0 0.0%
ptyNone of these Candidates -3 0.19% 0 0.0%
ptyThomas R. StevensAlden Link Objectivist3 0.19% 0 0.0%
ptyCarrie UnderwoodFred Thompson Republican2 0.13% 0 0.0%
ptyRoger CaleroAlyson Kennedy Socialist Workers1 0.06% 0 0.0%
ptyAlan KeyesWiley Drake Independent1 0.06% 0 0.0%
ptyJohn EdwardsWesley Clark Southern Write-In1 0.06% 0 0.0%
ptyMitt RomneyBill Owens Other1 0.06% 0 0.0%
ptyStephen T. ColbertStephen T. ColberT Independent1 0.06% 0 0.0%
ptyHillary ClintonAl Gore Democratic1 0.06% 0 0.0%
ptySteve AdamsBob Hargis Independent1 0.06% 0 0.0%
ptyHillary ClintonJoseph Biden Democratic1 0.06% 0 0.0%
ptyJosh D. OndichFox Grigor Independence1 0.06% 0 0.0%
ptyHillary ClintonCollin Powell Sane Party1 0.06% 0 0.0%
ptyRon PaulBarry Goldwater Jr. Conservative1 0.06% 0 0.0%

sealTotal Votes Cast

1,550
VTO (%REG)
vto graph
piepie

U. S. National Results Map
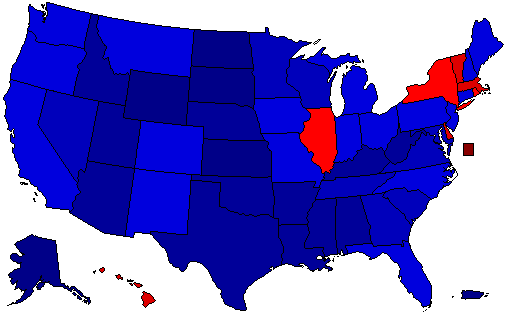
Mock Election 2008 Mapkey


EV Chart

270 |
538 |
John McCain457 
 
Barack Obama81 
 
Cynthia McKinney
 
Bob Barr
 
Write-ins
 
Chuck Baldwin
 
Ralph Nader
 
Mitt Romney
 
Brian Moore
 
Charles Jay
 
None of these Candidates
 
Thomas R. Stevens
 
Carrie Underwood
 
Roger Calero
 
Alan Keyes
 
John Edwards
 
Mitt Romney
 
Stephen T. Colbert
 
Hillary Clinton
 
Steve Adams
 
Hillary Clinton
 
Josh D. Ondich
 
Hillary Clinton
 
Ron Paul
 

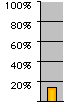
U.S. Voting Statistics

Democrats Republicans Independents Libertarians Other
Total: 609 Total: 480 Total: 275 Total: 69 Total: 117
dem pierep pieind pielib pieoth pie


Total Results - Canada

  Presidential
Candidate
Vice Presidential
Candidate
Political
Party
Popular Vote
pty Barack Obama Joseph Biden Democratic 9 60.00%
pty John McCain Sarah Palin Republican 5 33.33%
pty Ralph Nader Matt Gonzalez Independent 1 6.67%


Total Results - Europe

  Presidential
Candidate
Vice Presidential
Candidate
Political
Party
Popular Vote
pty Barack Obama Joseph Biden Democratic 50 76.92%
pty John McCain Sarah Palin Republican 12 18.46%
pty Cynthia McKinney Rosa Clemente Green 2 3.08%
pty Bob Barr Wayne Allyn Root Libertarian 1 1.54%


Total Results - World

  Presidential
Candidate
Vice Presidential
Candidate
Political
Party
Popular Vote
pty John McCain Sarah Palin Republican 919 56.48%
pty Barack Obama Joseph Biden Democratic 560 34.42%
pty Cynthia McKinney Rosa Clemente Green 55 3.38%
pty Bob Barr Wayne Allyn Root Libertarian 44 2.70%
pty Ralph Nader Matt Gonzalez Independent 16 0.98%
pty Chuck Baldwin Darrell Castle Constitution 16 0.98%
pty Brian Moore Stewart Alexander Socialist 6 0.37%
pty Charles Jay Tom Knapp Boston Tea Party 3 0.18%
pty Thomas R. Stevens Alden Link Objectivist 3 0.18%
pty None of these Candidates - - 3 0.18%
pty Roger Calero Alyson Kennedy Socialist Workers 1 0.06%
pty Alan Keyes Wiley Drake Independent 1 0.06%


Mock Election Home


Terms of Use - DCMA Policy - Privacy Policy and Cookies

© Dave Leip's Atlas of U.S. Elections, LLC 2019 All Rights Reserved

Valid XHTML 1.0!