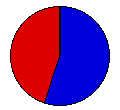
| Map | Pie | Office | Total | D | R | I | Margin | %Margin | Dem | Rep | Ind | Oth. | Dem | Rep | Ind | Other | | | | | | | | | | | | | | | | | | |
|---|
 |  | President |
238,608 |
2 |
1 |
- |
26,509 |
11.11% |
44.28% |
55.39% |
0.00% |
0.33% |
105,661 |
132,170 |
0 |
777 |
 |  | Senator |
239,711 |
1 |
2 |
0 |
5,375 |
2.24% |
51.12% |
48.88% |
0.00% |
0.00% |
122,543 |
117,168 |
0 |
0 |
 |  | Governor |
240,150 |
2 |
1 |
0 |
18,082 |
7.53% |
46.24% |
53.76% |
0.00% |
0.00% |
111,034 |
129,116 |
0 |
0 |
 |  | Lt. Governor |
237,045 |
1 |
2 |
0 |
2,103 |
0.89% |
50.44% |
49.56% |
0.00% |
0.00% |
119,574 |
117,471 |
0 |
0 |
 |  | Secretary of State |
237,056 |
1 |
2 |
0 |
10,008 |
4.22% |
52.11% |
47.89% |
0.00% |
0.00% |
123,532 |
113,524 |
0 |
0 |
 |  | State Treasurer |
235,909 |
1 |
2 |
0 |
11,191 |
4.74% |
52.37% |
47.63% |
0.00% |
0.00% |
123,550 |
112,359 |
0 |
0 |
 |  | Attorney General |
235,847 |
1 |
2 |
0 |
8,205 |
3.48% |
51.74% |
48.26% |
0.00% |
0.00% |
122,026 |
113,821 |
0 |
0 |
 |  | State Auditor |
236,128 |
1 |
2 |
0 |
19,568 |
8.29% |
54.14% |
45.86% |
0.00% |
0.00% |
127,848 |
108,280 |
0 |
0 |
|


