| Map | Pie | Office | Total | D | R | I | Margin | %Margin | Dem | Rep | Ind | Oth. | Dem | Rep | Ind | Other | | | | | | | | | | | | | | | | | | |
|---|
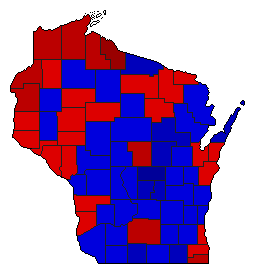
 |  | President |
1,729,082 |
2 |
1 |
0 |
64,370 |
3.72% |
48.05% |
51.77% |
0.00% |
0.18% |
830,805 |
895,175 |
0 |
3,102 |
 | | Governor |
1,727,991 |
1 |
2 |
0 |
53,745 |
3.11% |
51.56% |
48.44% |
0.00% |
0.00% |
890,868 |
837,123 |
0 |
0 |
 |  | Lt. Governor |
1,673,258 |
2 |
1 |
0 |
60,148 |
3.59% |
48.20% |
51.80% |
0.00% |
0.00% |
806,549 |
866,697 |
0 |
12 |
 |  | Secretary of State |
1,672,008 |
2 |
1 |
0 |
189,097 |
11.31% |
44.34% |
55.65% |
0.00% |
0.00% |
741,450 |
930,547 |
0 |
11 |
 |  | State Treasurer |
1,651,642 |
2 |
1 |
0 |
33,898 |
2.05% |
48.97% |
51.02% |
0.00% |
0.00% |
808,844 |
842,742 |
0 |
56 |
 |  | Attorney General |
1,653,418 |
1 |
2 |
0 |
29,486 |
1.78% |
50.89% |
49.11% |
0.00% |
0.00% |
841,445 |
811,959 |
0 |
14 |
|
