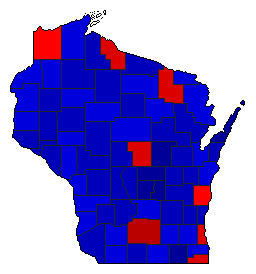
| Map | Pie | Office | Total | D | R | I | Margin | %Margin | Dem | Rep | Ind | Oth. | Dem | Rep | Ind | Other | | | | | | | | | | | | | | | | | | |
|---|
 |  | President |
1,276,800 |
1 |
2 |
0 |
56,351 |
4.41% |
50.70% |
46.28% |
0.00% |
3.02% |
647,310 |
590,959 |
0 |
38,531 |
 | | Governor |
1,266,139 |
2 |
1 |
3 |
126,342 |
9.98% |
44.11% |
54.09% |
1.02% |
0.78% |
558,497 |
684,839 |
12,928 |
9,875 |
 |  | Lt. Governor |
1,220,856 |
2 |
1 |
3 |
10,781 |
0.88% |
48.47% |
49.35% |
1.16% |
1.02% |
591,732 |
602,513 |
14,213 |
12,398 |
 |  | Secretary of State |
1,229,960 |
2 |
1 |
3 |
204,451 |
16.62% |
40.70% |
57.32% |
1.04% |
0.94% |
500,589 |
705,040 |
12,777 |
11,554 |
 |  | State Treasurer |
1,205,546 |
2 |
1 |
3 |
104,544 |
8.67% |
44.67% |
53.34% |
1.06% |
0.93% |
538,525 |
643,069 |
12,780 |
11,172 |
 |  | Attorney General |
1,208,201 |
1 |
2 |
3 |
59,014 |
4.88% |
51.51% |
46.62% |
0.99% |
0.88% |
622,312 |
563,298 |
11,908 |
10,683 |
|