| Map | Pie | Year | Total | D | R | I | Margin | %Margin | Dem | Rep | Ind | Oth. | Dem | Rep | Ind | Other | | | | | | | | | | | | | | | | | | |
|---|
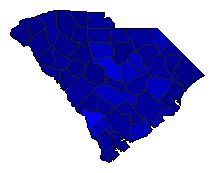
|  | 2022 |
1,398,392 |
0 |
1 |
0 |
871,920 |
62.35% |
0.00% |
77.60% |
0.00% |
22.40% |
0 |
1,085,139 |
0 |
313,253 |
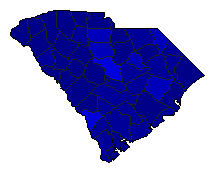
 |  | 2018 |
1,341,300 |
0 |
1 |
0 |
813,128 |
60.62% |
0.00% |
75.70% |
0.00% |
24.30% |
0 |
1,015,366 |
0 |
325,934 |
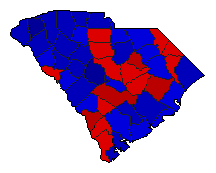
 | | 2014 |
953,616 |
0 |
1 |
2 |
653,417 |
68.52% |
0.00% |
79.66% |
11.14% |
9.20% |
0 |
759,640 |
106,223 |
87,753 |
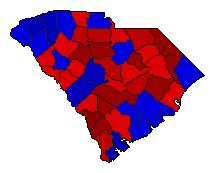
 |  | 2010 |
1,318,022 |
2 |
1 |
0 |
267,031 |
20.26% |
39.85% |
60.11% |
0.00% |
0.04% |
525,229 |
792,260 |
0 |
533 |
 |  | 2006 |
1,065,477 |
2 |
1 |
0 |
206,648 |
19.39% |
40.29% |
59.68% |
0.00% |
0.03% |
429,255 |
635,903 |
0 |
319 |
 |  | 2002 |
1,063,070 |
2 |
1 |
0 |
11,573 |
1.09% |
49.44% |
50.53% |
0.00% |
0.03% |
525,595 |
537,168 |
0 |
307 |
 |  | 1994 |
885,496 |
2 |
1 |
0 |
208,081 |
23.50% |
38.24% |
61.74% |
0.00% |
0.03% |
338,589 |
546,670 |
0 |
237 |
 |  | 1990 |
696,638 |
2 |
1 |
0 |
27,799 |
3.99% |
47.99% |
51.98% |
0.00% |
0.04% |
334,288 |
362,087 |
0 |
263 |
 |  | 1982 |
652,306 |
1 |
2 |
0 |
19,195 |
2.94% |
51.47% |
48.52% |
0.00% |
0.01% |
335,718 |
316,523 |
0 |
65 |
 |  | 1978 |
595,794 |
2 |
1 |
0 |
66,539 |
11.17% |
44.39% |
55.56% |
0.00% |
0.04% |
264,499 |
331,038 |
0 |
257 |
 |  | 1974 |
494,309 |
1 |
2 |
3 |
202,079 |
40.88% |
69.33% |
28.45% |
2.22% |
0.00% |
342,716 |
140,637 |
10,956 |
0 |
|
