| Map | Pie | Office | Total | D | R | I | Margin | %Margin | Dem | Rep | Ind | Oth. | Dem | Rep | Ind | Other | | | | | | | | | | | | | | | | | | |
|---|
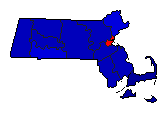
 |  | President |
414,804 |
2 |
1 |
- |
81,869 |
19.74% |
37.85% |
57.59% |
0.00% |
4.57% |
156,997 |
238,866 |
0 |
18,941 |
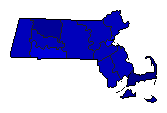
 | | Governor |
386,126 |
2 |
1 |
3 |
97,976 |
25.37% |
33.69% |
59.06% |
3.43% |
3.82% |
130,078 |
228,054 |
13,260 |
14,734 |
 |  | Lt. Governor |
381,878 |
2 |
1 |
5 |
104,158 |
27.28% |
33.38% |
60.65% |
1.41% |
4.56% |
127,459 |
231,617 |
5,389 |
17,413 |
 |  | Secretary of State |
369,540 |
2 |
1 |
3 |
102,497 |
27.74% |
32.43% |
60.17% |
3.66% |
3.74% |
119,845 |
222,342 |
13,532 |
13,821 |
 |  | State Treasurer |
369,153 |
2 |
1 |
5 |
101,643 |
27.53% |
32.72% |
60.26% |
1.68% |
5.34% |
120,795 |
222,438 |
6,207 |
19,713 |
 |  | Attorney General |
368,260 |
2 |
1 |
3 |
96,987 |
26.34% |
33.00% |
59.33% |
3.47% |
4.19% |
121,518 |
218,505 |
12,791 |
15,446 |
 |  | State Auditor |
365,769 |
2 |
1 |
5 |
80,559 |
22.02% |
34.38% |
56.40% |
1.93% |
7.29% |
125,742 |
206,301 |
7,057 |
26,669 |
|
