| Map | Pie | Office | Total | D | R | I | Margin | %Margin | Dem | Rep | Ind | Oth. | Dem | Rep | Ind | Other | | | | | | | | | | | | | | | | | | |
|---|
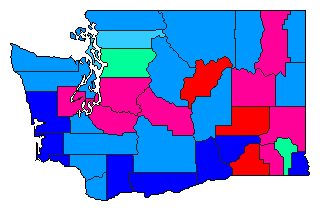
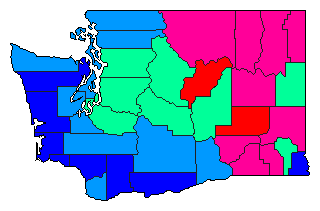
 |  | President |
322,799 |
2 |
3 |
1 |
26,858 |
8.32% |
26.90% |
21.82% |
35.22% |
16.05% |
86,840 |
70,445 |
113,698 |
51,816 |
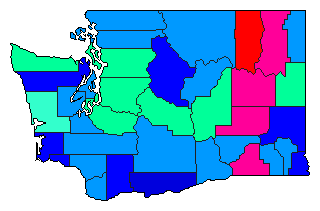
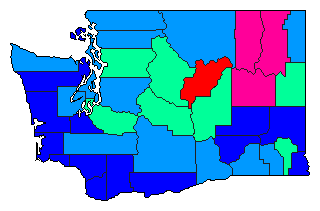
 | | Governor |
318,298 |
1 |
2 |
3 |
622 |
0.20% |
30.55% |
30.36% |
24.42% |
14.67% |
97,251 |
96,629 |
77,731 |
46,687 |
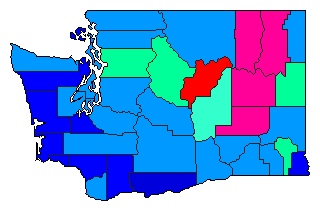
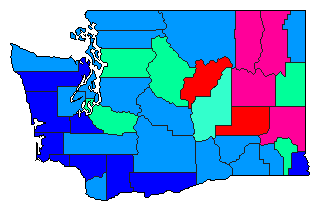
 | | Lt. Governor |
296,928 |
3 |
1 |
2 |
8,456 |
2.85% |
25.75% |
32.04% |
29.19% |
13.02% |
76,473 |
95,128 |
86,672 |
38,655 |
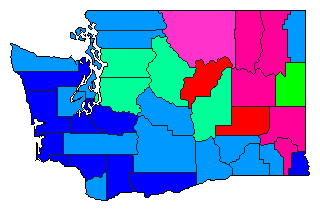
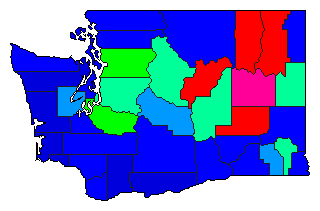
 |  | Secretary of State |
292,971 |
3 |
1 |
2 |
17,676 |
6.03% |
24.29% |
34.12% |
28.08% |
13.51% |
71,154 |
99,949 |
82,273 |
39,595 |
 |  | State Treasurer |
293,647 |
3 |
1 |
2 |
9,690 |
3.30% |
24.38% |
32.54% |
29.24% |
13.85% |
71,583 |
95,543 |
85,853 |
40,668 |
 |  | Attorney General |
289,732 |
3 |
1 |
2 |
6,732 |
2.32% |
25.04% |
31.68% |
29.36% |
13.92% |
72,542 |
91,789 |
85,057 |
40,344 |
 |  | Comptroller General |
297,923 |
3 |
1 |
2 |
13,049 |
4.38% |
23.15% |
32.75% |
28.37% |
15.73% |
68,980 |
97,560 |
84,511 |
46,872 |
 |  | State Auditor |
290,977 |
3 |
1 |
2 |
15,550 |
5.34% |
24.55% |
33.58% |
28.24% |
13.64% |
71,424 |
97,710 |
82,160 |
39,683 |
 |  | Insurance Commissioner |
252,914 |
3 |
1 |
2 |
15,066 |
5.96% |
28.30% |
38.83% |
32.87% |
0.00% |
71,584 |
98,198 |
83,132 |
0 |
|
