| Map | Pie | Office | Total | D | R | I | Margin | %Margin | Dem | Rep | Ind | Oth. | Dem | Rep | Ind | Other | | | | | | | | | | | | | | | | | | |
|---|
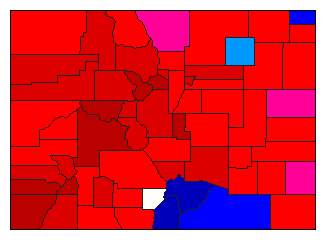
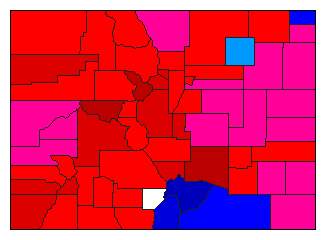
 |  | President |
266,880 |
1 |
3 |
2 |
41,926 |
15.71% |
42.80% |
21.88% |
27.09% |
8.23% |
114,232 |
58,386 |
72,306 |
21,956 |
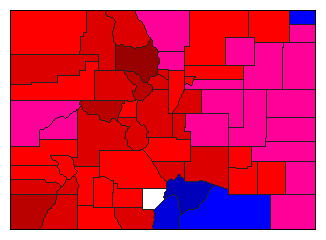
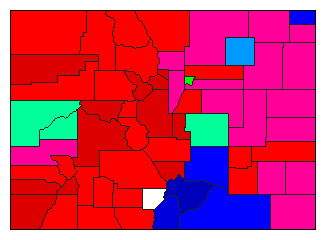
 |  | Senator |
249,806 |
1 |
2 |
3 |
51,311 |
20.54% |
47.34% |
26.80% |
23.48% |
2.38% |
118,260 |
66,949 |
58,649 |
5,948 |
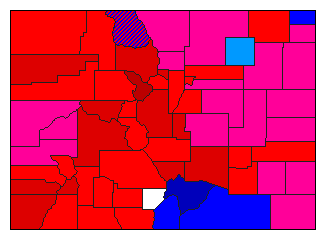
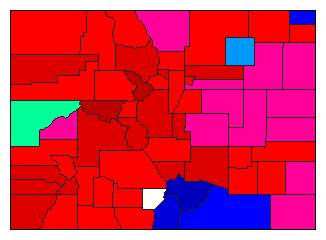
 |  | Governor |
265,791 |
1 |
3 |
2 |
47,912 |
18.03% |
42.91% |
23.73% |
24.88% |
8.49% |
114,044 |
63,061 |
66,132 |
22,554 |
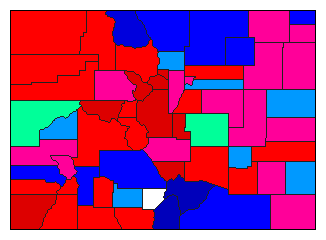
 |  | Lt. Governor |
263,951 |
1 |
3 |
2 |
43,508 |
16.48% |
41.50% |
24.54% |
25.02% |
8.94% |
109,544 |
64,765 |
66,036 |
23,606 |
 |  | Secretary of State |
253,635 |
1 |
2 |
3 |
12,545 |
4.95% |
38.96% |
34.02% |
20.41% |
6.62% |
98,821 |
86,276 |
51,757 |
16,781 |
 |  | State Treasurer |
263,994 |
1 |
2 |
3 |
46,906 |
17.77% |
42.61% |
24.84% |
23.80% |
8.74% |
112,493 |
65,587 |
62,834 |
23,080 |
 |  | Attorney General |
269,179 |
1 |
3 |
2 |
35,170 |
13.07% |
39.63% |
25.13% |
26.56% |
8.67% |
106,675 |
67,655 |
71,505 |
23,344 |
 |  | State Auditor |
264,113 |
1 |
2 |
3 |
50,389 |
19.08% |
43.80% |
24.72% |
22.71% |
8.77% |
115,675 |
65,286 |
59,989 |
23,163 |
|
