| Map | Pie | Year | Total | D | R | I | Margin | %Margin | Dem | Rep | Ind | Oth. | Dem | Rep | Ind | Other | | | | | | | | | | | | | | | | | | |
|---|
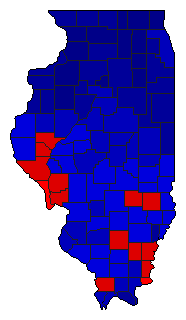
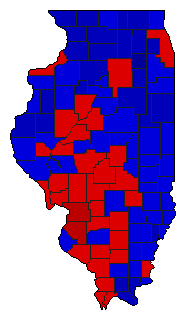 | | 1968 |
4,368,365 |
1 |
2 |
0 |
96,421 |
2.21% |
50.87% |
48.67% |
0.00% |
0.46% |
2,222,331 |
2,125,910 |
0 |
20,124 |
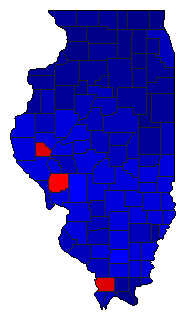
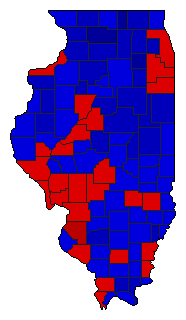 | | 1960 |
4,569,883 |
1 |
2 |
3 |
236,103 |
5.17% |
52.49% |
47.32% |
0.19% |
0.00% |
2,398,746 |
2,162,643 |
8,494 |
0 |
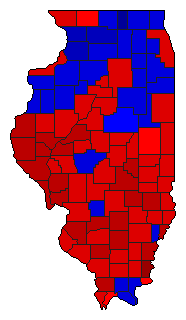 |  | 1932 |
3,184,652 |
1 |
2 |
3 |
242,132 |
7.60% |
52.95% |
45.35% |
1.20% |
0.51% |
1,686,265 |
1,444,133 |
38,163 |
16,091 |
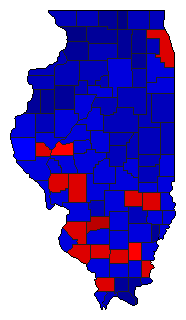 |  | 1928 |
2,877,281 |
2 |
1 |
3 |
286,418 |
9.95% |
44.72% |
54.68% |
0.44% |
0.16% |
1,286,765 |
1,573,183 |
12,745 |
4,588 |
 |  | 1924 |
2,252,246 |
2 |
1 |
3 |
775,127 |
34.42% |
32.30% |
66.71% |
0.72% |
0.27% |
727,390 |
1,502,517 |
16,235 |
6,104 |
 |  | 1920 |
2,071,290 |
2 |
1 |
3 |
715,493 |
34.54% |
29.63% |
64.17% |
3.11% |
3.10% |
613,626 |
1,329,119 |
64,342 |
64,203 |
|
