| Map | Pie | Office | Total | D | R | I | Margin | %Margin | Dem | Rep | Ind | Oth. | Dem | Rep | Ind | Other | | | | | | | | | | | | | | | | | | |
|---|
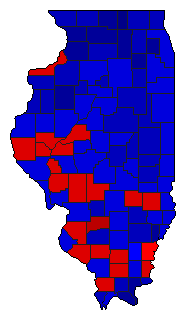
 |  | President |
3,107,489 |
2 |
1 |
- |
455,324 |
14.65% |
42.28% |
56.93% |
0.00% |
0.79% |
1,313,817 |
1,769,141 |
0 |
24,531 |
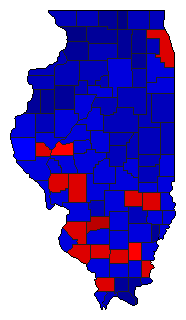
 | | Governor |
3,012,203 |
2 |
1 |
0 |
424,921 |
14.11% |
42.66% |
56.76% |
0.00% |
0.58% |
1,284,897 |
1,709,818 |
0 |
17,488 |
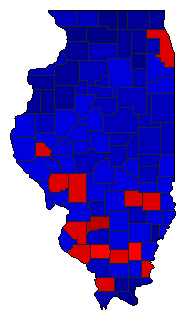
 |  | Lt. Governor |
2,877,281 |
2 |
1 |
3 |
286,418 |
9.95% |
44.72% |
54.68% |
0.44% |
0.16% |
1,286,765 |
1,573,183 |
12,745 |
4,588 |
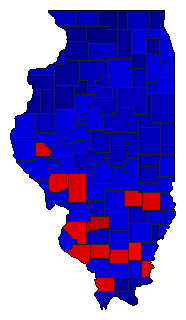
 |  | Secretary of State |
2,882,042 |
2 |
1 |
3 |
269,095 |
9.34% |
45.03% |
54.37% |
0.44% |
0.16% |
1,297,840 |
1,566,935 |
12,574 |
4,693 |
 |  | State Treasurer |
2,853,650 |
2 |
1 |
3 |
413,065 |
14.47% |
42.51% |
56.99% |
0.45% |
0.05% |
1,213,188 |
1,626,253 |
12,707 |
1,502 |
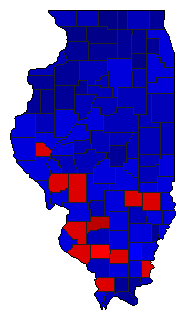 | | Attorney General |
2,882,617 |
2 |
1 |
0 |
553,061 |
19.19% |
40.11% |
59.30% |
0.00% |
0.59% |
1,156,287 |
1,709,348 |
0 |
16,982 |
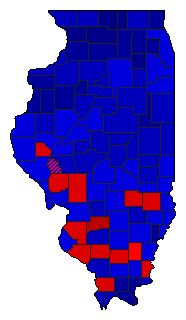 |  | State Auditor |
2,878,441 |
2 |
1 |
3 |
553,912 |
19.24% |
40.13% |
59.37% |
0.44% |
0.06% |
1,155,093 |
1,709,005 |
12,709 |
1,634 |
|