| Map | Pie | Office | Total | D | R | I | Margin | %Margin | Dem | Rep | Ind | Oth. | Dem | Rep | Ind | Other | | | | | | | | | | | | | | | | | | |
|---|
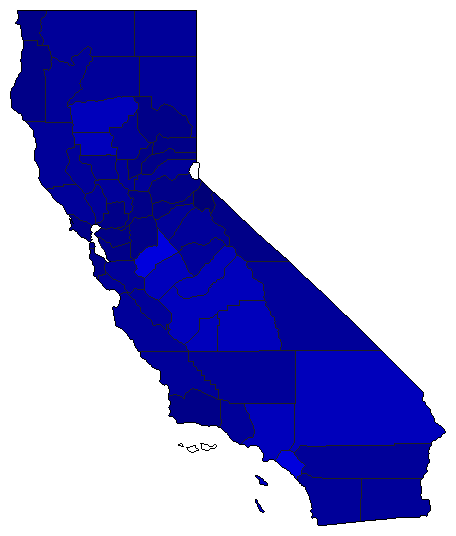 |  | Governor |
1,385,129 |
2 |
1 |
3 |
665,420 |
48.04% |
24.11% |
72.15% |
3.64% |
0.09% |
333,973 |
999,393 |
50,480 |
1,283 |
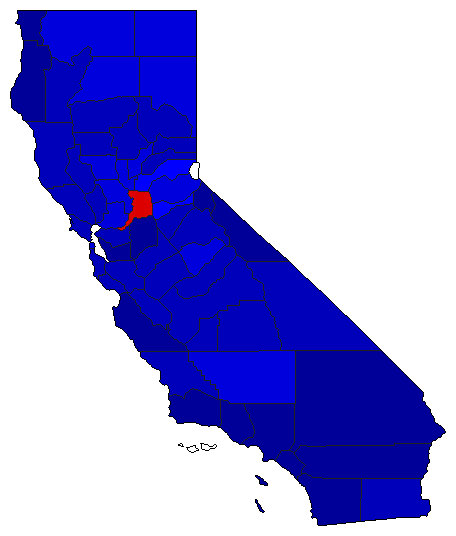 |  | Lt. Governor |
1,325,261 |
2 |
1 |
3 |
475,765 |
35.90% |
30.47% |
66.37% |
3.14% |
0.01% |
403,832 |
879,597 |
41,638 |
194 |
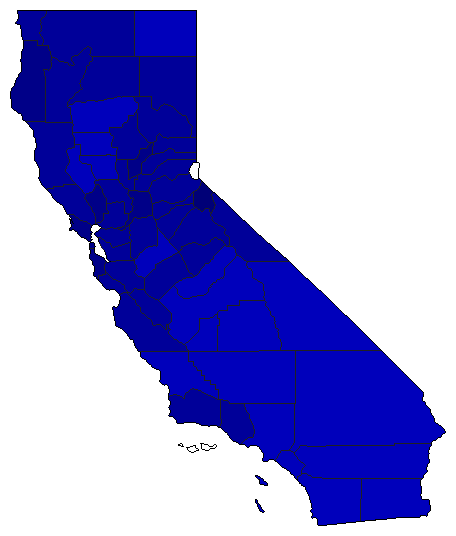 |  | Secretary of State |
1,256,854 |
2 |
1 |
3 |
666,065 |
52.99% |
17.45% |
70.44% |
12.10% |
0.01% |
219,311 |
885,376 |
152,034 |
133 |
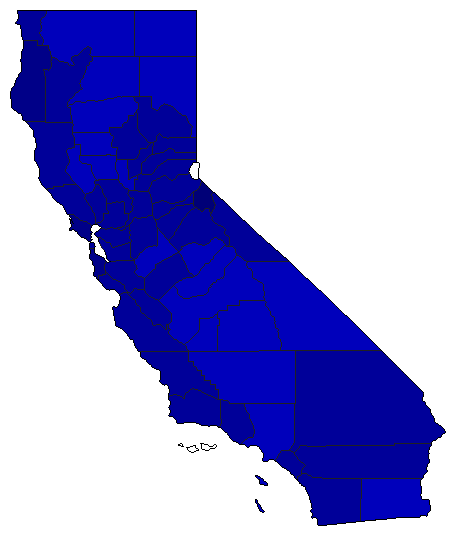 |  | State Treasurer |
1,213,127 |
2 |
1 |
3 |
638,716 |
52.65% |
20.39% |
73.04% |
6.56% |
0.00% |
247,387 |
886,103 |
79,619 |
18 |
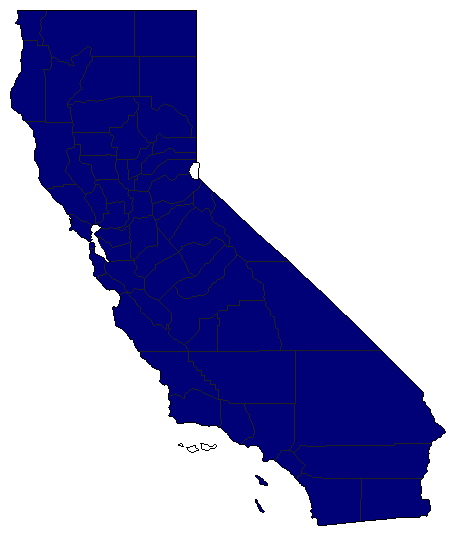 |  | Attorney General |
1,039,304 |
0 |
1 |
0 |
1,038,856 |
99.96% |
0.00% |
99.98% |
0.00% |
0.02% |
0 |
1,039,080 |
0 |
224 |
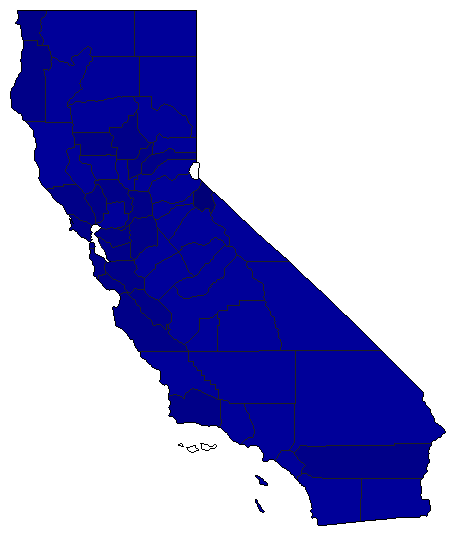 |  | Controller |
1,188,990 |
2 |
1 |
0 |
686,017 |
57.70% |
21.15% |
78.85% |
0.00% |
0.00% |
251,475 |
937,492 |
0 |
23 |
|


