| Map | Pie | Office | Total | D | R | I | Margin | %Margin | Dem | Rep | Ind | Oth. | Dem | Rep | Ind | Other | | | | | | | | | | | | | | | | | | |
|---|
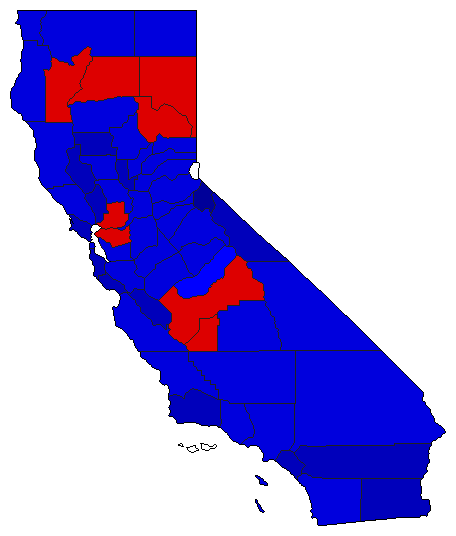 |  | Senator |
2,639,465 |
2 |
1 |
3 |
260,906 |
9.88% |
44.22% |
54.10% |
1.62% |
0.06% |
1,167,161 |
1,428,067 |
42,683 |
1,554 |
 |  | Governor |
2,558,399 |
0 |
1 |
2 |
2,163,963 |
84.58% |
0.00% |
91.64% |
7.06% |
1.30% |
0 |
2,344,542 |
180,579 |
33,278 |
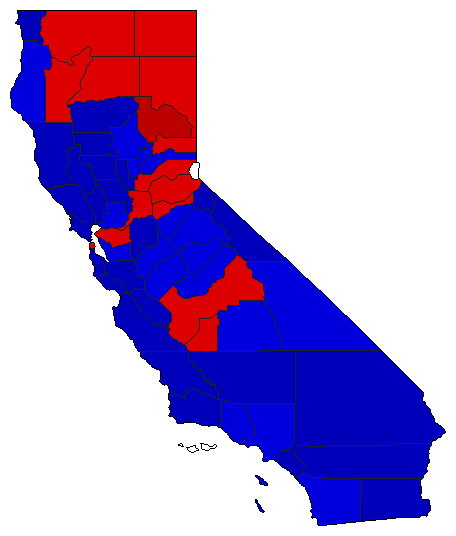 |  | Lt. Governor |
2,608,051 |
2 |
1 |
0 |
333,264 |
12.78% |
43.60% |
56.38% |
0.00% |
0.01% |
1,137,232 |
1,470,496 |
0 |
323 |
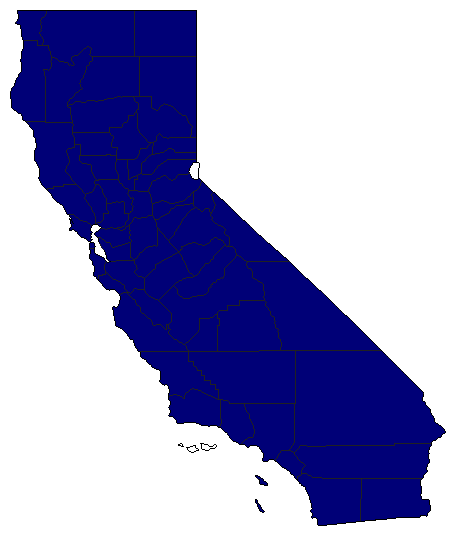
 |  | Secretary of State |
2,167,359 |
0 |
1 |
0 |
2,165,829 |
99.93% |
0.00% |
99.96% |
0.00% |
0.04% |
0 |
2,166,594 |
0 |
765 |
 |  | State Treasurer |
2,131,709 |
0 |
1 |
0 |
2,130,745 |
99.95% |
0.00% |
99.98% |
0.00% |
0.02% |
0 |
2,131,227 |
0 |
482 |
 |  | Attorney General |
2,570,914 |
2 |
1 |
3 |
344,380 |
13.40% |
41.63% |
55.03% |
3.33% |
0.00% |
1,070,364 |
1,414,744 |
85,688 |
118 |
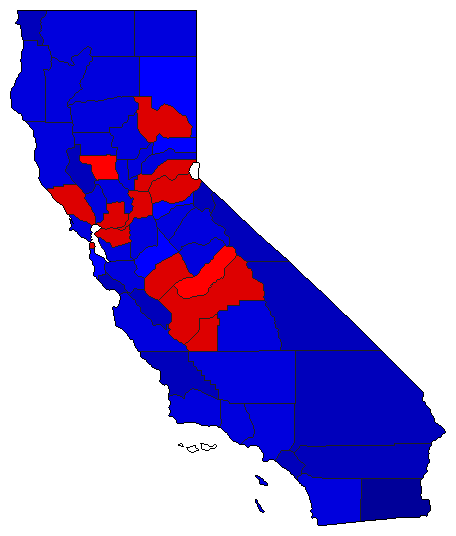
 |  | Controller |
2,324,586 |
0 |
1 |
2 |
1,908,928 |
82.12% |
0.00% |
91.05% |
8.93% |
0.01% |
0 |
2,116,618 |
207,690 |
278 |
|
