Note: The Google advertisement links below may advocate political positions that this site does not endorse.
| Map | Pie | Office | Total | D | R | I | Margin | %Margin | Dem | Rep | Ind | Oth. | Dem | Rep | Ind | Other | | | | | | | | | | | | | | | | | | |
|---|
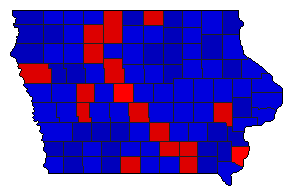 |  | Senator |
858,523 |
2 |
1 |
3 |
86,847 |
10.12% |
44.70% |
54.82% |
0.38% |
0.10% |
383,766 |
470,613 |
3,273 |
871 |
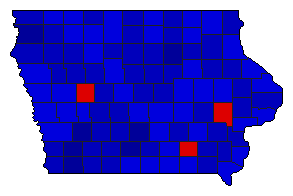 |  | Governor |
857,213 |
2 |
1 |
3 |
159,466 |
18.60% |
40.50% |
59.10% |
0.33% |
0.07% |
347,176 |
506,642 |
2,805 |
590 |
 |  | Lt. Governor |
804,657 |
2 |
1 |
3 |
146,016 |
18.15% |
40.71% |
58.85% |
0.37% |
0.07% |
327,561 |
473,577 |
2,960 |
559 |
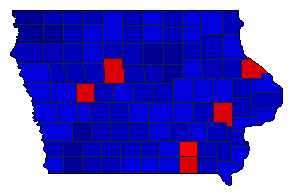 |  | Secretary of State |
798,465 |
2 |
1 |
3 |
156,635 |
19.62% |
39.99% |
59.60% |
0.41% |
0.00% |
319,271 |
475,906 |
3,288 |
0 |
|
