| Map | Pie | Office | Total | D | R | I | Margin | %Margin | Dem | Rep | Ind | Oth. | Dem | Rep | Ind | Other | | | | | | | | | | | | | | | | | | |
|---|
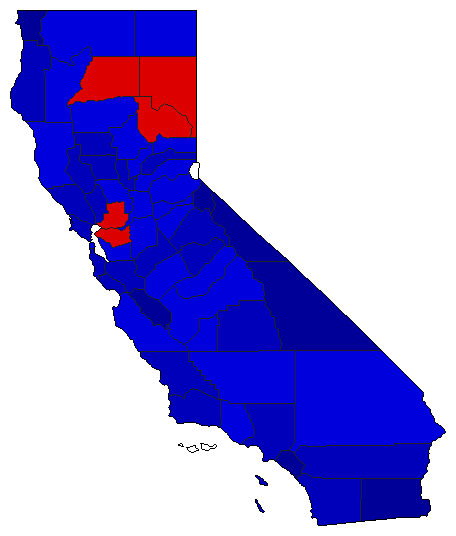 | | Senator |
3,686,315 |
2 |
1 |
0 |
680,947 |
18.47% |
40.76% |
59.23% |
0.00% |
0.01% |
1,502,507 |
2,183,454 |
0 |
354 |
 | | Governor |
3,796,090 |
2 |
1 |
0 |
1,127,898 |
29.71% |
35.14% |
64.85% |
0.00% |
0.01% |
1,333,856 |
2,461,754 |
0 |
480 |
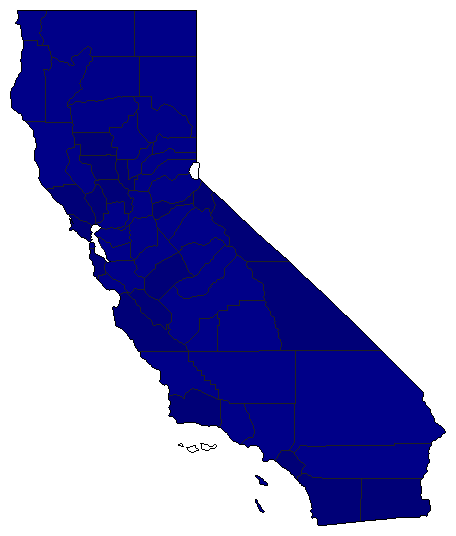
 |  | Lt. Governor |
3,092,428 |
0 |
1 |
0 |
3,086,685 |
99.81% |
0.00% |
99.90% |
0.00% |
0.10% |
0 |
3,089,278 |
0 |
3,150 |
 |  | Secretary of State |
3,350,870 |
0 |
1 |
0 |
2,732,791 |
81.55% |
0.00% |
90.78% |
0.00% |
9.22% |
0 |
3,041,791 |
0 |
309,079 |
 |  | State Treasurer |
3,292,693 |
0 |
1 |
0 |
2,802,216 |
85.10% |
0.00% |
92.55% |
0.00% |
7.45% |
0 |
3,047,411 |
0 |
245,282 |
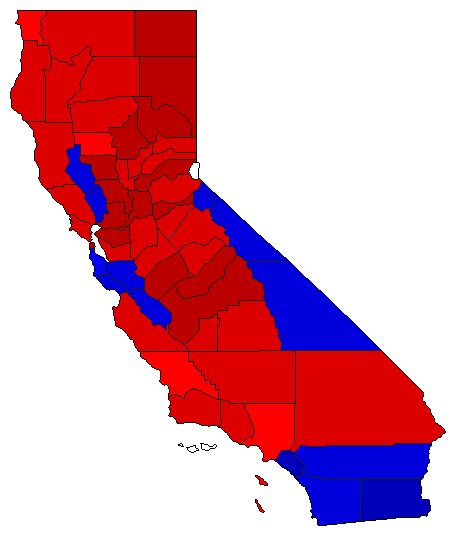 |  | Attorney General |
3,590,702 |
1 |
2 |
0 |
225,775 |
6.29% |
51.80% |
45.51% |
0.00% |
2.70% |
1,859,822 |
1,634,047 |
0 |
96,833 |
 |  | Controller |
3,316,169 |
0 |
1 |
0 |
2,706,733 |
81.62% |
0.00% |
88.21% |
0.00% |
11.79% |
0 |
2,925,183 |
0 |
390,986 |
|
