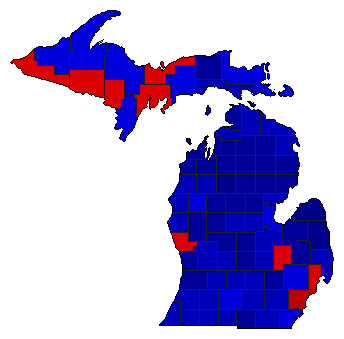
Note: The Google advertisement links below may advocate political positions that this site does not endorse.
| Map | Pie | Year | Total | D | R | I | Margin | %Margin | Dem | Rep | Ind | Oth. | Dem | Rep | Ind | Other | | | | | | | | | | | | | | | | | | |
|---|
 | | 1954 |
2,110,302 |
1 |
2 |
3 |
41,707 |
1.98% |
50.84% |
48.86% |
0.22% |
0.07% |
1,072,869 |
1,031,162 |
4,707 |
1,564 |
 | | 1952 |
2,762,362 |
2 |
1 |
3 |
169,320 |
6.13% |
46.77% |
52.90% |
0.28% |
0.05% |
1,291,880 |
1,461,200 |
7,861 |
1,421 |
|