| Map | Pie | Office | Total | D | R | I | Margin | %Margin | Dem | Rep | Ind | Oth. | Dem | Rep | Ind | Other | | | | | | | | | | | | | | | | | | |
|---|
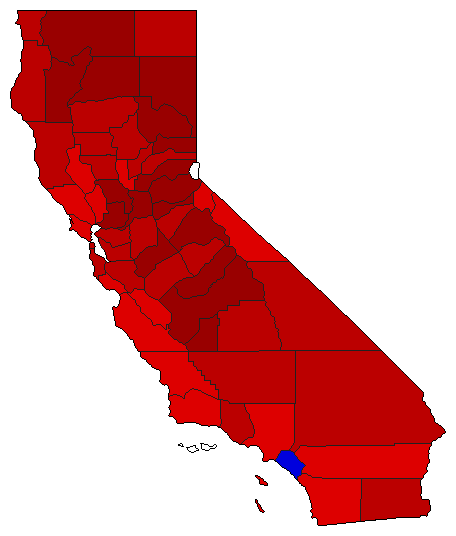
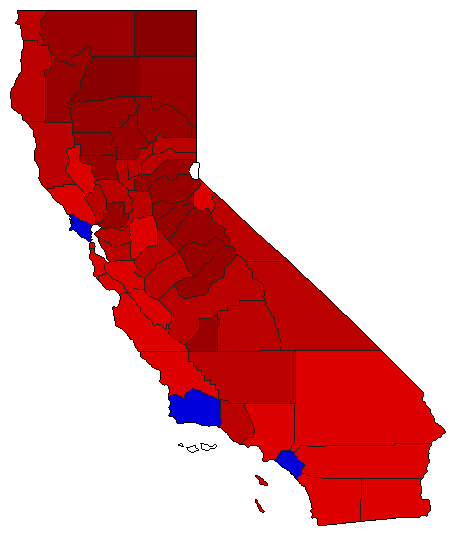 | | Senator |
5,135,221 |
1 |
2 |
0 |
723,356 |
14.09% |
57.01% |
42.93% |
0.00% |
0.06% |
2,927,693 |
2,204,337 |
0 |
3,191 |
 | | Governor |
5,255,777 |
1 |
2 |
0 |
1,029,165 |
19.58% |
59.75% |
40.16% |
0.00% |
0.09% |
3,140,076 |
2,110,911 |
0 |
4,790 |
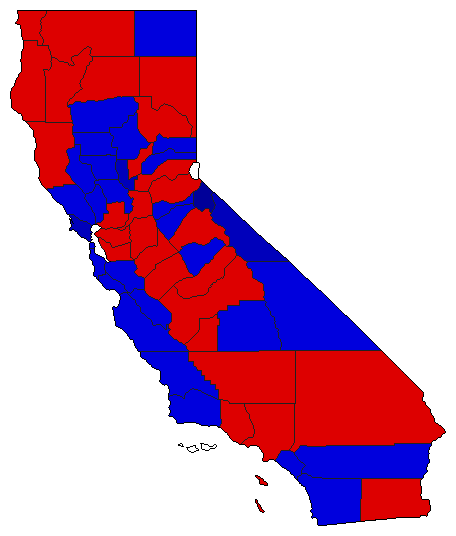
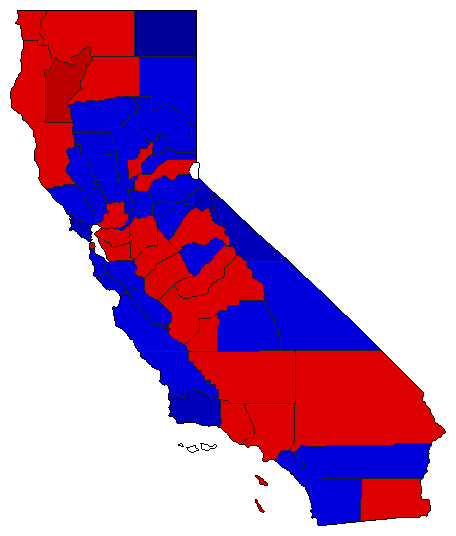 |  | Lt. Governor |
5,164,546 |
1 |
2 |
3 |
90,230 |
1.75% |
50.86% |
49.11% |
0.01% |
0.02% |
2,626,626 |
2,536,396 |
729 |
795 |
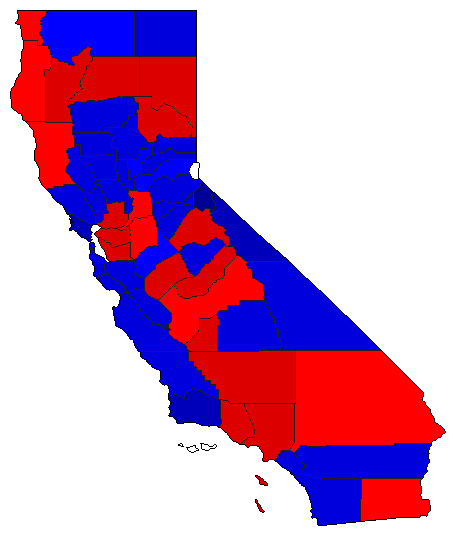 |  | Secretary of State |
5,118,527 |
2 |
1 |
0 |
46,741 |
0.91% |
48.27% |
49.19% |
0.00% |
2.54% |
2,470,854 |
2,517,595 |
0 |
130,078 |
 |  | State Treasurer |
4,995,507 |
1 |
2 |
0 |
185,521 |
3.71% |
51.85% |
48.13% |
0.00% |
0.02% |
2,589,985 |
2,404,464 |
0 |
1,058 |
 |  | Attorney General |
5,063,449 |
1 |
2 |
0 |
1,151,197 |
22.74% |
61.36% |
38.62% |
0.00% |
0.02% |
3,106,788 |
1,955,591 |
0 |
1,070 |
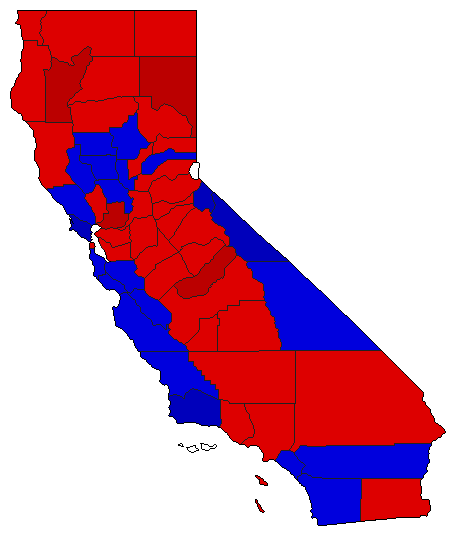
 |  | Controller |
5,075,451 |
1 |
2 |
0 |
31,523 |
0.62% |
50.30% |
49.68% |
0.00% |
0.02% |
2,553,020 |
2,521,497 |
0 |
934 |
|
