| Map | Pie | Office | Total | D | R | I | Margin | %Margin | Dem | Rep | Ind | Oth. | Dem | Rep | Ind | Other | | | | | | | | | | | | | | | | | | |
|---|
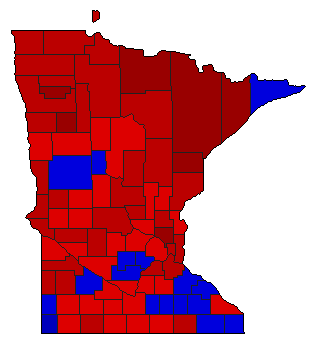
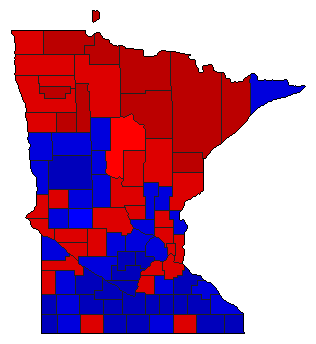 | | Governor |
1,246,536 |
2 |
1 |
3 |
142 |
0.01% |
49.70% |
49.72% |
0.58% |
0.00% |
619,580 |
619,722 |
7,234 |
0 |
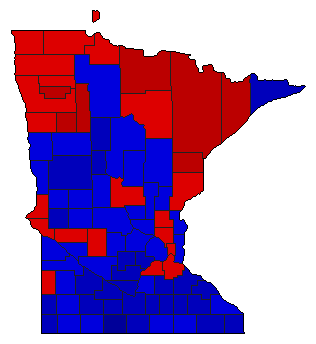
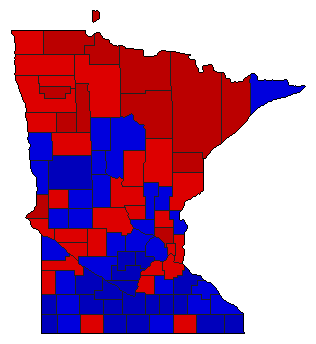 |  | Lt. Governor |
1,222,601 |
1 |
2 |
0 |
4,699 |
0.38% |
50.19% |
49.81% |
0.00% |
0.00% |
613,650 |
608,951 |
0 |
0 |
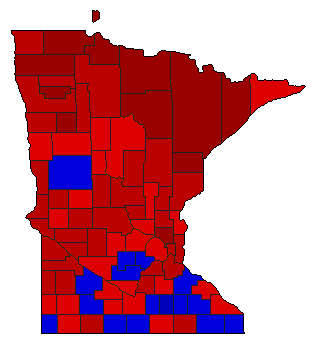 |  | Secretary of State |
1,223,905 |
1 |
2 |
0 |
235,217 |
19.22% |
59.61% |
40.39% |
0.00% |
0.00% |
729,561 |
494,344 |
0 |
0 |
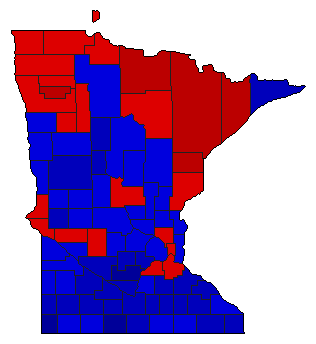 |  | State Treasurer |
1,219,645 |
2 |
1 |
0 |
112,231 |
9.20% |
45.40% |
54.60% |
0.00% |
0.00% |
553,707 |
665,938 |
0 |
0 |
 |  | Attorney General |
1,225,404 |
1 |
2 |
0 |
236,162 |
19.27% |
59.64% |
40.36% |
0.00% |
0.00% |
730,783 |
494,621 |
0 |
0 |
 |  | State Auditor |
1,218,143 |
2 |
1 |
0 |
98,079 |
8.05% |
45.97% |
54.03% |
0.00% |
0.00% |
560,032 |
658,111 |
0 |
0 |
|
