| Map | Pie | Office | Total | D | R | I | Margin | %Margin | Dem | Rep | Ind | Oth. | Dem | Rep | Ind | Other | | | | | | | | | | | | | | | | | | |
|---|
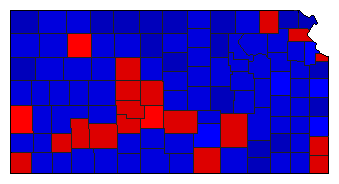 |  | Senator |
671,345 |
2 |
1 |
0 |
46,854 |
6.98% |
45.17% |
52.15% |
0.00% |
2.69% |
303,223 |
350,077 |
0 |
18,045 |
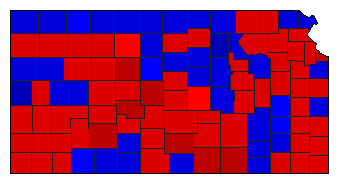 |  | Governor |
692,955 |
1 |
2 |
0 |
75,705 |
10.92% |
54.84% |
43.92% |
0.00% |
1.24% |
380,030 |
304,325 |
0 |
8,600 |
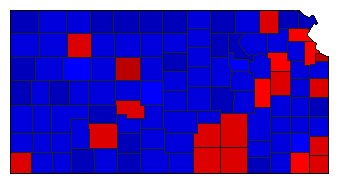 |  | Lt. Governor |
652,521 |
2 |
1 |
0 |
17,922 |
2.75% |
47.08% |
49.83% |
0.00% |
3.10% |
307,200 |
325,122 |
0 |
20,199 |
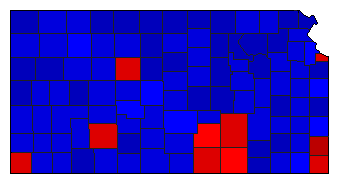
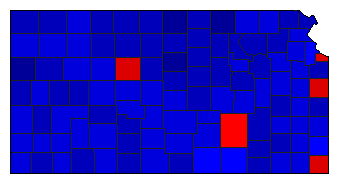 |  | Secretary of State |
638,373 |
2 |
1 |
0 |
85,633 |
13.41% |
42.29% |
55.70% |
0.00% |
2.01% |
269,961 |
355,594 |
0 |
12,818 |
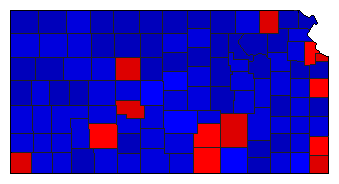
 |  | State Treasurer |
629,268 |
2 |
1 |
0 |
54,745 |
8.70% |
43.55% |
52.25% |
0.00% |
4.19% |
274,065 |
328,810 |
0 |
26,393 |
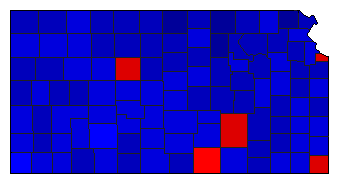
 |  | Attorney General |
635,965 |
2 |
1 |
0 |
72,180 |
11.35% |
42.58% |
53.93% |
0.00% |
3.49% |
270,796 |
342,976 |
0 |
22,193 |
 |  | State Auditor |
621,842 |
2 |
1 |
0 |
46,652 |
7.50% |
45.17% |
52.67% |
0.00% |
2.17% |
280,858 |
327,510 |
0 |
13,474 |
 |  | Insurance Commissioner |
617,030 |
2 |
1 |
0 |
94,935 |
15.39% |
41.45% |
56.84% |
0.00% |
1.71% |
255,764 |
350,699 |
0 |
10,567 |
|