Note: The Google advertisement links below may advocate political positions that this site does not endorse.
| Map | Pie | Office | Total | D | R | I | Margin | %Margin | Dem | Rep | Ind | Oth. | Dem | Rep | Ind | Other | | | | | | | | | | | | | | | | | | |
|---|
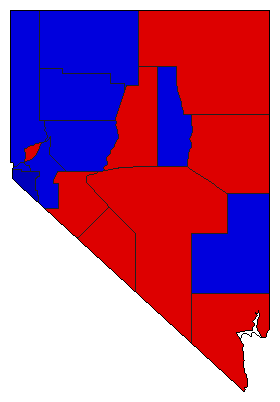 | | Governor |
137,677 |
2 |
1 |
0 |
5,937 |
4.31% |
47.84% |
52.16% |
0.00% |
0.00% |
65,870 |
71,807 |
0 |
0 |
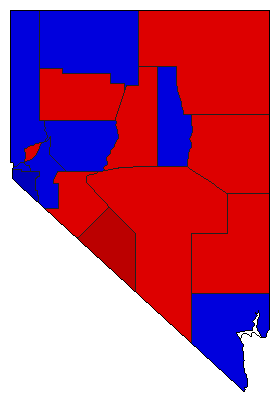 | | Lt. Governor |
135,433 |
2 |
1 |
0 |
8,023 |
5.92% |
47.04% |
52.96% |
0.00% |
0.00% |
63,705 |
71,728 |
0 |
0 |
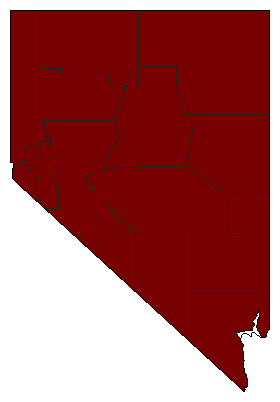
 | | Secretary of State |
115,177 |
1 |
0 |
0 |
64,743 |
56.21% |
78.11% |
0.00% |
0.00% |
21.89% |
89,960 |
0 |
0 |
25,217 |
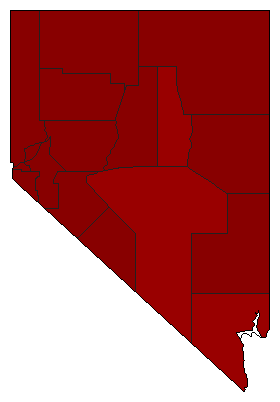
 | | State Treasurer |
91,411 |
1 |
0 |
0 |
91,411 |
100.00% |
100.00% |
0.00% |
0.00% |
0.00% |
91,411 |
0 |
0 |
0 |
 | | Attorney General |
126,021 |
1 |
2 |
0 |
40,615 |
32.23% |
66.11% |
33.89% |
0.00% |
0.00% |
83,318 |
42,703 |
0 |
0 |
 | | Controller |
121,858 |
2 |
1 |
0 |
17,156 |
14.08% |
42.96% |
57.04% |
0.00% |
0.00% |
52,351 |
69,507 |
0 |
0 |
|
