| Map | Pie | Office | Total | D | R | I | Margin | %Margin | Dem | Rep | Ind | Oth. | Dem | Rep | Ind | Other | | | | | | | | | | | | | | | | | | |
|---|
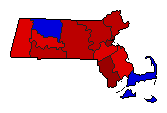 | | Senator |
1,935,607 |
1 |
2 |
0 |
486,878 |
25.15% |
62.14% |
36.99% |
0.00% |
0.87% |
1,202,856 |
715,978 |
0 |
16,773 |
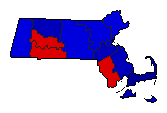 | | Governor |
1,867,906 |
2 |
1 |
0 |
259,354 |
13.88% |
42.79% |
56.67% |
0.00% |
0.54% |
799,269 |
1,058,623 |
0 |
10,014 |
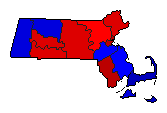 | | Secretary of State |
1,860,293 |
1 |
2 |
4 |
170,378 |
9.16% |
53.84% |
44.68% |
0.55% |
0.94% |
1,001,528 |
831,150 |
10,165 |
17,450 |
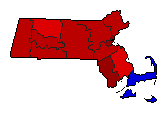 | | State Treasurer |
1,811,697 |
1 |
2 |
4 |
595,699 |
32.88% |
65.61% |
32.73% |
0.52% |
1.14% |
1,188,633 |
592,934 |
9,457 |
20,673 |
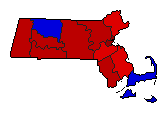 | | Attorney General |
1,887,803 |
1 |
2 |
3 |
477,502 |
25.29% |
62.22% |
36.92% |
0.86% |
0.00% |
1,174,512 |
697,010 |
16,257 |
24 |
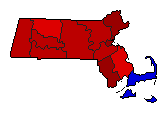 | | State Auditor |
1,828,520 |
1 |
2 |
3 |
648,605 |
35.47% |
66.87% |
31.40% |
0.99% |
0.73% |
1,222,783 |
574,178 |
18,184 |
13,375 |
|


