| Map | Pie | Office | Total | D | R | I | Margin | %Margin | Dem | Rep | Ind | Oth. | Dem | Rep | Ind | Other | | | | | | | | | | | | | | | | | | |
|---|
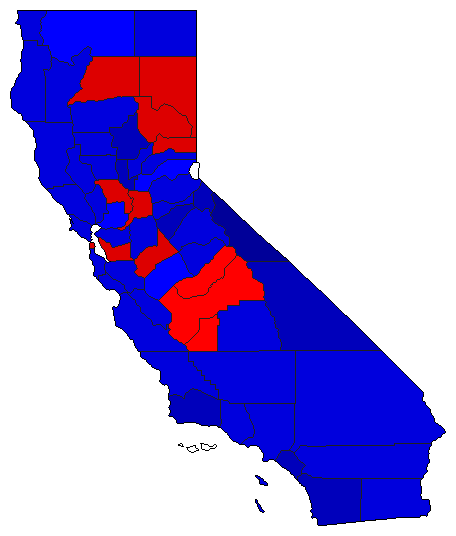
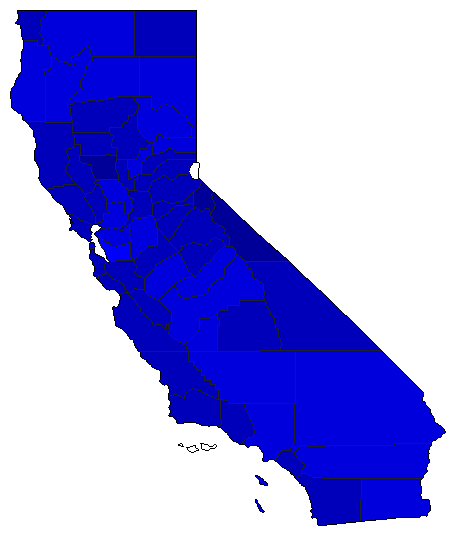
 | | Senator |
6,492,157 |
1 |
2 |
0 |
618,941 |
9.53% |
53.86% |
44.32% |
0.00% |
1.82% |
3,496,558 |
2,877,617 |
0 |
117,982 |
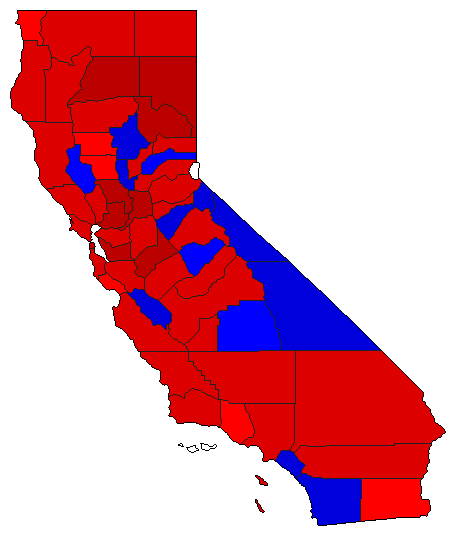
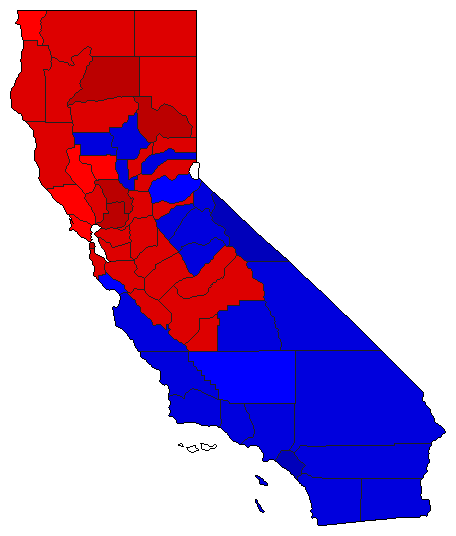
 | | Governor |
6,510,072 |
2 |
1 |
0 |
501,057 |
7.70% |
45.14% |
52.84% |
0.00% |
2.02% |
2,938,607 |
3,439,664 |
0 |
131,801 |
 |  | Lt. Governor |
6,426,672 |
2 |
1 |
0 |
802,161 |
12.48% |
42.31% |
54.79% |
0.00% |
2.91% |
2,718,904 |
3,521,065 |
0 |
186,703 |
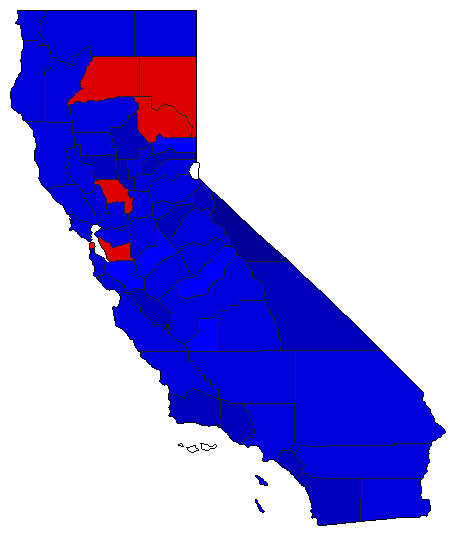
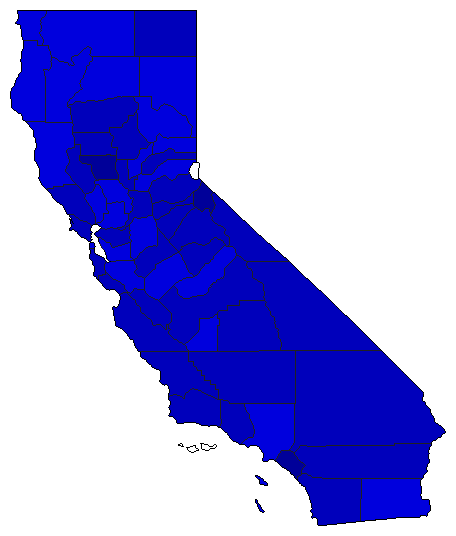
 |  | Secretary of State |
6,416,423 |
1 |
2 |
0 |
308,175 |
4.80% |
50.41% |
45.61% |
0.00% |
3.97% |
3,234,788 |
2,926,613 |
0 |
255,022 |
 |  | State Treasurer |
6,336,389 |
2 |
1 |
0 |
1,170,852 |
18.48% |
39.81% |
58.29% |
0.00% |
1.90% |
2,522,536 |
3,693,388 |
0 |
120,465 |
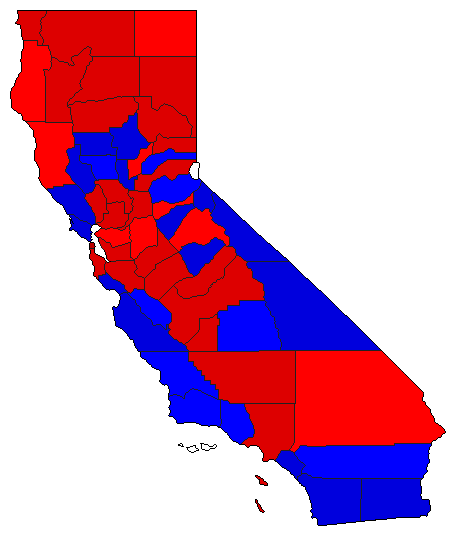
 |  | Attorney General |
6,371,719 |
2 |
1 |
0 |
86,171 |
1.35% |
47.93% |
49.28% |
0.00% |
2.79% |
3,053,916 |
3,140,087 |
0 |
177,716 |
 |  | Controller |
6,282,083 |
2 |
1 |
0 |
1,435,926 |
22.86% |
37.38% |
60.24% |
0.00% |
2.39% |
2,348,098 |
3,784,024 |
0 |
149,961 |
|
