| Map | Pie | Office | Total | D | R | I | Margin | %Margin | Dem | Rep | Ind | Oth. | Dem | Rep | Ind | Other | | | | | | | | | | | | | | | | | | |
|---|
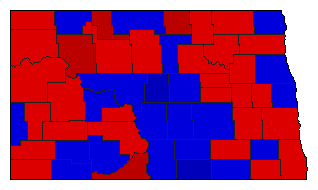
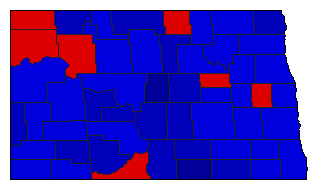
 |  | President |
280,514 |
2 |
1 |
- |
73,725 |
26.28% |
35.79% |
62.07% |
0.00% |
2.15% |
100,384 |
174,109 |
0 |
6,021 |
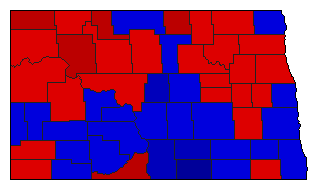
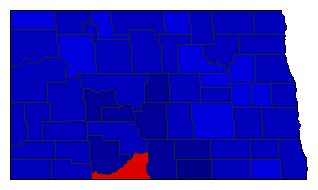
 | | Governor |
281,931 |
1 |
2 |
0 |
5,867 |
2.08% |
51.04% |
48.96% |
0.00% |
0.00% |
143,899 |
138,032 |
0 |
0 |
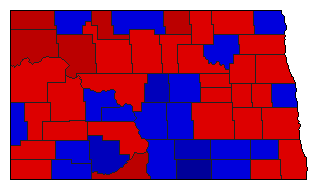
 |  | Lt. Governor |
265,162 |
1 |
2 |
0 |
1,724 |
0.65% |
50.33% |
49.67% |
0.00% |
0.00% |
133,443 |
131,719 |
0 |
0 |
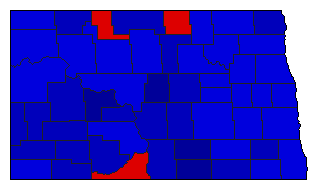
 |  | Secretary of State |
256,042 |
2 |
1 |
0 |
85,488 |
33.39% |
33.31% |
66.69% |
0.00% |
0.00% |
85,277 |
170,765 |
0 |
0 |
 |  | State Treasurer |
256,067 |
1 |
2 |
0 |
4,355 |
1.70% |
50.85% |
49.15% |
0.00% |
0.00% |
130,211 |
125,856 |
0 |
0 |
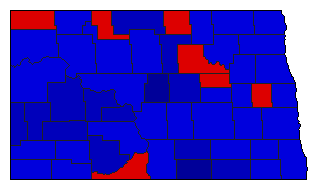
 |  | Attorney General |
256,692 |
2 |
1 |
0 |
40,886 |
15.93% |
42.04% |
57.96% |
0.00% |
0.00% |
107,903 |
148,789 |
0 |
0 |
 |  | State Auditor |
251,419 |
2 |
1 |
0 |
67,965 |
27.03% |
36.48% |
63.52% |
0.00% |
0.00% |
91,727 |
159,692 |
0 |
0 |
 |  | Insurance Commissioner |
247,477 |
2 |
1 |
0 |
44,305 |
17.90% |
41.05% |
58.95% |
0.00% |
0.00% |
101,586 |
145,891 |
0 |
0 |
 |  | Agriculture Commissioner |
256,566 |
2 |
1 |
0 |
33,684 |
13.13% |
43.44% |
56.56% |
0.00% |
0.00% |
111,441 |
145,125 |
0 |
0 |
|
