| Map | Pie | Office | Total | D | R | I | Margin | %Margin | Dem | Rep | Ind | Oth. | Dem | Rep | Ind | Other | | | | | | | | | | | | | | | | | | |
|---|
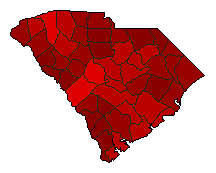
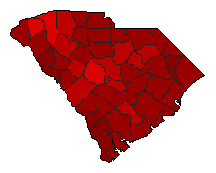 | | Senator |
511,380 |
1 |
2 |
3 |
208,458 |
40.76% |
69.44% |
28.68% |
1.88% |
0.00% |
355,107 |
146,649 |
9,624 |
0 |
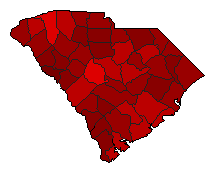
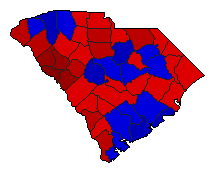 | | Governor |
523,512 |
2 |
1 |
3 |
17,477 |
3.34% |
47.54% |
50.88% |
1.59% |
0.00% |
248,861 |
266,338 |
8,313 |
0 |
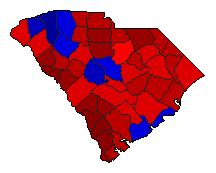 | | Lt. Governor |
516,704 |
1 |
2 |
3 |
33,176 |
6.42% |
52.74% |
46.32% |
0.95% |
0.00% |
272,493 |
239,317 |
4,894 |
0 |
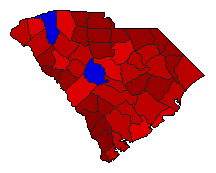
 | | Secretary of State |
492,547 |
1 |
2 |
3 |
204,037 |
41.42% |
69.67% |
28.24% |
2.09% |
0.00% |
343,154 |
139,117 |
10,276 |
0 |
 | | Attorney General |
507,945 |
1 |
2 |
3 |
116,561 |
22.95% |
60.91% |
37.96% |
1.13% |
0.00% |
309,394 |
192,833 |
5,718 |
0 |
 | | Comptroller General |
495,972 |
1 |
2 |
3 |
181,925 |
36.68% |
67.42% |
30.74% |
1.83% |
0.00% |
334,406 |
152,481 |
9,085 |
0 |
 |  | Agriculture Commissioner |
494,309 |
1 |
2 |
3 |
202,079 |
40.88% |
69.33% |
28.45% |
2.22% |
0.00% |
342,716 |
140,637 |
10,956 |
0 |
|
