Note: The Google advertisement links below may advocate political positions that this site does not endorse.
| Map | Pie | Office | Total | D | R | I | Margin | %Margin | Dem | Rep | Ind | Oth. | Dem | Rep | Ind | Other | | | | | | | | | | | | | | | | | | |
|---|
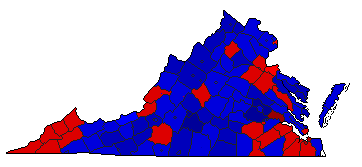 |  | Governor |
1,250,940 |
2 |
1 |
3 |
157,983 |
12.63% |
43.27% |
55.90% |
0.81% |
0.02% |
541,319 |
699,302 |
10,101 |
218 |
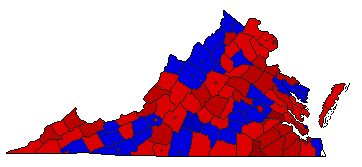 |  | Lt. Governor |
1,202,275 |
1 |
2 |
0 |
101,968 |
8.48% |
54.24% |
45.76% |
0.00% |
0.01% |
652,084 |
550,116 |
0 |
75 |
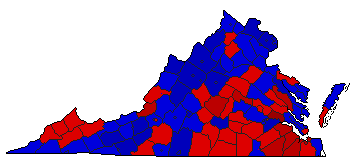 |  | Attorney General |
1,153,033 |
2 |
1 |
0 |
82,290 |
7.14% |
46.43% |
53.57% |
0.00% |
0.01% |
535,338 |
617,628 |
0 |
67 |
|
