| Map | Pie | Office | Total | D | R | I | Margin | %Margin | Dem | Rep | Ind | Oth. | Dem | Rep | Ind | Other | | | | | | | | | | | | | | | | | | |
|---|
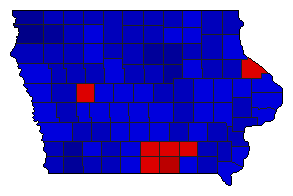
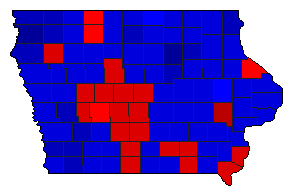 | | Senator |
824,654 |
2 |
1 |
3 |
26,532 |
3.22% |
47.91% |
51.12% |
0.51% |
0.46% |
395,066 |
421,598 |
4,223 |
3,767 |
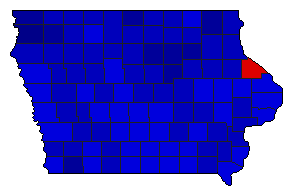
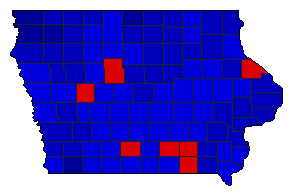 | | Governor |
843,190 |
2 |
1 |
3 |
146,194 |
17.34% |
40.98% |
58.32% |
0.47% |
0.24% |
345,519 |
491,713 |
3,947 |
2,011 |
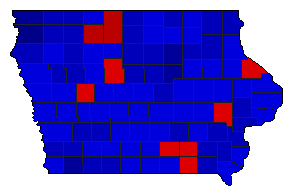 |  | State Treasurer |
755,972 |
2 |
1 |
0 |
83,629 |
11.06% |
44.47% |
55.53% |
0.00% |
0.00% |
336,163 |
419,792 |
0 |
17 |
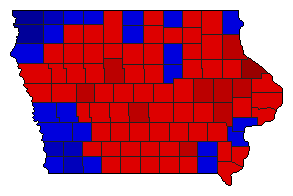 |  | Attorney General |
796,706 |
1 |
2 |
0 |
91,644 |
11.50% |
55.59% |
44.09% |
0.00% |
0.32% |
442,895 |
351,251 |
0 |
2,560 |
 |  | State Auditor |
770,423 |
2 |
1 |
0 |
125,720 |
16.32% |
41.65% |
57.97% |
0.00% |
0.38% |
320,884 |
446,604 |
0 |
2,935 |
 |  | Agriculture Commissioner |
773,071 |
2 |
1 |
0 |
150,516 |
19.47% |
40.06% |
59.53% |
0.00% |
0.41% |
309,702 |
460,218 |
0 |
3,151 |
|
