| Map | Pie | Office | Total | D | R | I | Margin | %Margin | Dem | Rep | Ind | Oth. | Dem | Rep | Ind | Other | | | | | | | | | | | | | | | | | | |
|---|
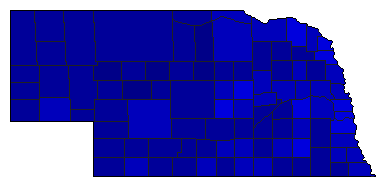
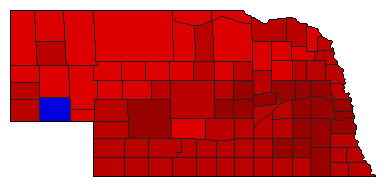 |  | Senator |
494,368 |
1 |
2 |
0 |
174,470 |
35.29% |
67.62% |
32.33% |
0.00% |
0.06% |
334,276 |
159,806 |
0 |
286 |
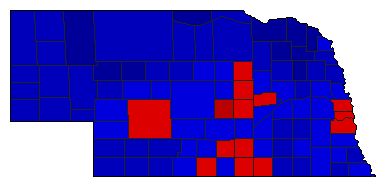
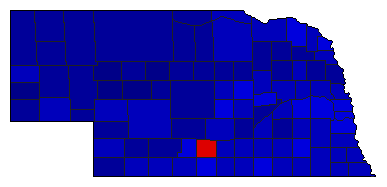
 | | Governor |
492,423 |
2 |
1 |
0 |
58,719 |
11.92% |
44.02% |
55.94% |
0.00% |
0.04% |
216,754 |
275,473 |
0 |
196 |
 | | Lt. Governor |
492,423 |
2 |
1 |
0 |
58,719 |
11.92% |
44.02% |
55.94% |
0.00% |
0.04% |
216,754 |
275,473 |
0 |
196 |
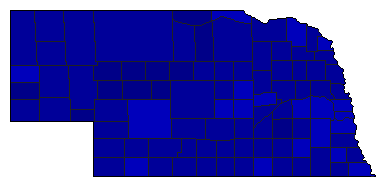 |  | Secretary of State |
460,178 |
2 |
1 |
0 |
182,452 |
39.65% |
30.17% |
69.82% |
0.00% |
0.02% |
138,823 |
321,275 |
0 |
80 |
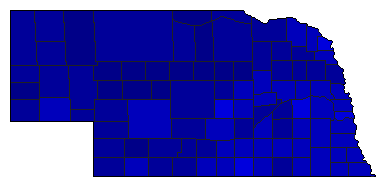 |  | State Treasurer |
452,906 |
2 |
1 |
0 |
160,009 |
35.33% |
32.33% |
67.66% |
0.00% |
0.01% |
146,424 |
306,433 |
0 |
49 |
 |  | Attorney General |
444,066 |
2 |
1 |
0 |
144,448 |
32.53% |
33.73% |
66.26% |
0.00% |
0.01% |
149,784 |
294,232 |
0 |
50 |
 |  | State Auditor |
432,109 |
2 |
1 |
0 |
118,167 |
27.35% |
36.32% |
63.67% |
0.00% |
0.02% |
156,937 |
275,104 |
0 |
68 |
|
