| Map | Pie | Office | Total | D | R | I | Margin | %Margin | Dem | Rep | Ind | Oth. | Dem | Rep | Ind | Other | | | | | | | | | | | | | | | | | | |
|---|
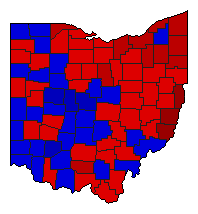
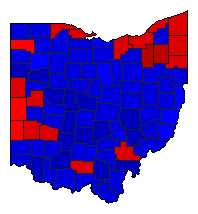 |  | Governor |
2,843,402 |
2 |
1 |
0 |
47,536 |
1.67% |
47.64% |
49.31% |
0.00% |
3.05% |
1,354,631 |
1,402,167 |
0 |
86,604 |
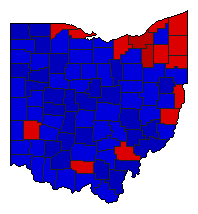 |  | Secretary of State |
2,722,178 |
1 |
2 |
0 |
8,260 |
0.30% |
50.15% |
49.85% |
0.00% |
0.00% |
1,365,219 |
1,356,959 |
0 |
0 |
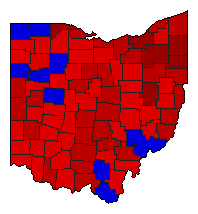 |  | State Treasurer |
2,581,169 |
1 |
2 |
0 |
697,465 |
27.02% |
63.51% |
36.49% |
0.00% |
0.00% |
1,639,317 |
941,852 |
0 |
0 |
 |  | Attorney General |
2,668,482 |
1 |
2 |
0 |
732,042 |
27.43% |
63.72% |
36.28% |
0.00% |
0.00% |
1,700,262 |
968,220 |
0 |
0 |
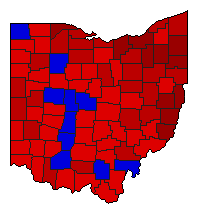
 |  | State Auditor |
2,632,548 |
1 |
2 |
0 |
277,890 |
10.56% |
55.28% |
44.72% |
0.00% |
0.00% |
1,455,219 |
1,177,329 |
0 |
0 |
|
