| Map | Pie | Office | Total | D | R | I | Margin | %Margin | Dem | Rep | Ind | Oth. | Dem | Rep | Ind | Other | | | | | | | | | | | | | | | | | | |
|---|
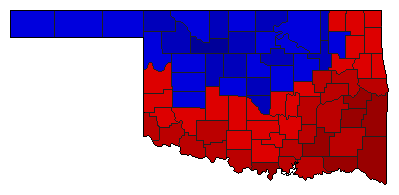
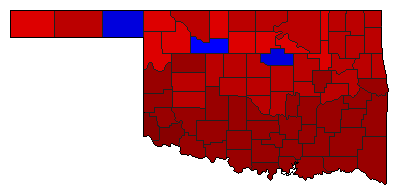 | | Senator |
754,264 |
1 |
2 |
0 |
246,096 |
32.63% |
65.49% |
32.86% |
0.00% |
1.65% |
493,953 |
247,857 |
0 |
12,454 |
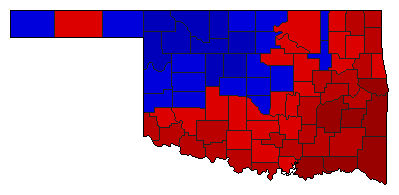 | | Governor |
777,414 |
1 |
2 |
0 |
35,185 |
4.53% |
51.74% |
47.21% |
0.00% |
1.04% |
402,240 |
367,055 |
0 |
8,119 |
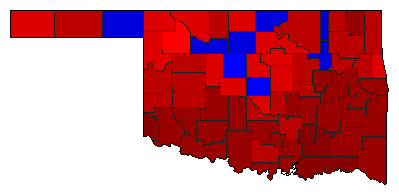 | | Lt. Governor |
714,869 |
1 |
2 |
3 |
129,569 |
18.12% |
57.83% |
39.71% |
2.46% |
0.00% |
413,429 |
283,860 |
17,580 |
0 |
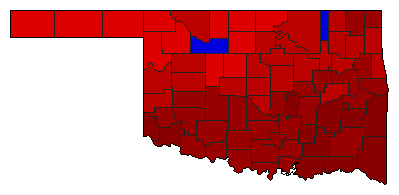
 | | State Treasurer |
699,268 |
1 |
2 |
0 |
162,324 |
23.21% |
61.61% |
38.39% |
0.00% |
0.00% |
430,796 |
268,472 |
0 |
0 |
 | | Attorney General |
691,232 |
1 |
2 |
0 |
223,876 |
32.39% |
66.19% |
33.81% |
0.00% |
0.00% |
457,554 |
233,678 |
0 |
0 |
 | | State Auditor |
686,663 |
2 |
1 |
0 |
57,953 |
8.44% |
45.78% |
54.22% |
0.00% |
0.00% |
314,355 |
372,308 |
0 |
0 |
| | | Map | Pie | Initiative | Total Vote | N | | Y | Margin | %Margin | No | | Yes | Oth. | No | | Yes | |
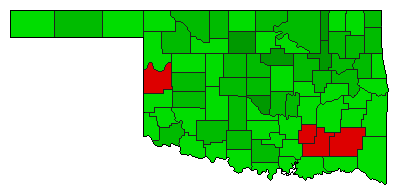 | | Referendum |
672,458 |
2 |
0 |
1 |
217,616 |
32.36% |
33.82% |
0.00% |
66.18% |
0.00% |
227,421 |
0 |
445,037 |
0 |
 | | Referendum |
669,585 |
2 |
0 |
1 |
146,491 |
21.88% |
39.06% |
0.00% |
60.94% |
0.00% |
261,547 |
0 |
408,038 |
0 |
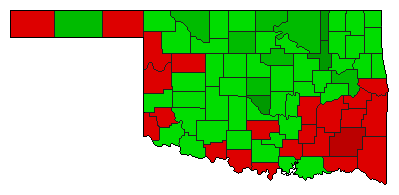
 | | Referendum |
726,346 |
1 |
0 |
2 |
96,564 |
13.29% |
56.65% |
0.00% |
43.35% |
0.00% |
411,455 |
0 |
314,891 |
0 |
|
