| Map | Pie | Office | Total | D | R | I | Margin | %Margin | Dem | Rep | Ind | Oth. | Dem | Rep | Ind | Other | | | | | | | | | | | | | | | | | | |
|---|
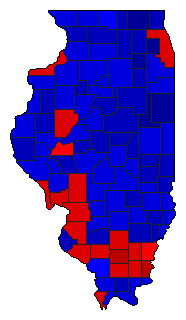 | | Governor |
3,673,707 |
2 |
1 |
0 |
5,074 |
0.14% |
49.30% |
49.44% |
0.00% |
1.27% |
1,811,027 |
1,816,101 |
0 |
46,579 |
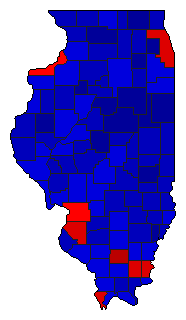 | | Secretary of State |
3,690,625 |
2 |
1 |
4 |
233,656 |
6.33% |
46.31% |
52.64% |
0.52% |
0.53% |
1,709,008 |
1,942,664 |
19,216 |
19,737 |
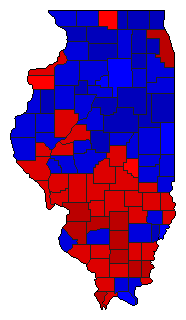 |  | State Treasurer |
3,607,049 |
1 |
2 |
0 |
367,332 |
10.18% |
53.81% |
43.62% |
0.00% |
2.57% |
1,940,828 |
1,573,496 |
0 |
92,725 |
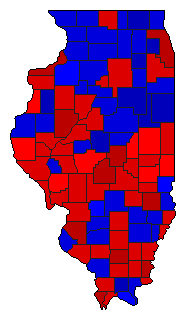 | | Attorney General |
3,636,508 |
1 |
2 |
0 |
544,689 |
14.98% |
56.76% |
41.78% |
0.00% |
1.45% |
2,064,196 |
1,519,507 |
0 |
52,805 |
 |  | Comptroller General |
3,612,949 |
1 |
2 |
0 |
1,117,312 |
30.93% |
64.43% |
33.50% |
0.00% |
2.07% |
2,327,779 |
1,210,467 |
0 |
74,703 |
|
