| Map | Pie | Office | Total | D | R | I | Margin | %Margin | Dem | Rep | Ind | Oth. | Dem | Rep | Ind | Other | | | | | | | | | | | | | | | | | | |
|---|
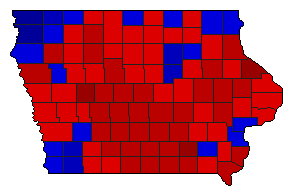
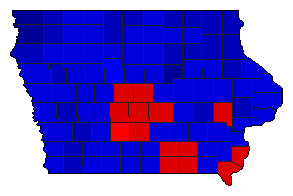 | | Governor |
1,038,229 |
2 |
1 |
4 |
65,022 |
6.26% |
46.55% |
52.81% |
0.27% |
0.37% |
483,291 |
548,313 |
2,767 |
3,858 |
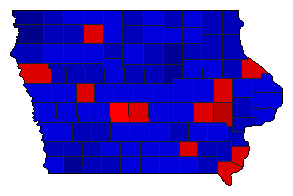
 |  | Lt. Governor |
985,164 |
1 |
2 |
0 |
48,959 |
4.97% |
52.11% |
47.14% |
0.00% |
0.74% |
513,396 |
464,437 |
0 |
7,331 |
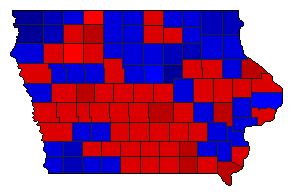
 |  | Secretary of State |
981,056 |
2 |
1 |
0 |
119,843 |
12.22% |
43.58% |
55.80% |
0.00% |
0.62% |
427,547 |
547,390 |
0 |
6,119 |
 |  | State Treasurer |
961,714 |
1 |
2 |
0 |
30,869 |
3.21% |
51.46% |
48.25% |
0.00% |
0.29% |
494,905 |
464,036 |
0 |
2,773 |
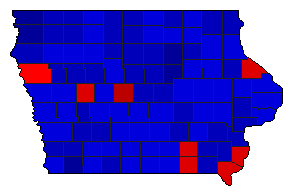
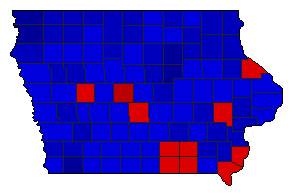
 |  | Attorney General |
971,093 |
1 |
2 |
0 |
188,993 |
19.46% |
59.45% |
39.98% |
0.00% |
0.57% |
577,277 |
388,284 |
0 |
5,532 |
 |  | State Auditor |
945,350 |
2 |
1 |
0 |
81,621 |
8.63% |
45.48% |
54.11% |
0.00% |
0.41% |
429,938 |
511,559 |
0 |
3,853 |
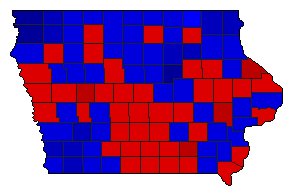
 |  | Agriculture Commissioner |
973,522 |
2 |
1 |
0 |
110,913 |
11.39% |
43.98% |
55.37% |
0.00% |
0.65% |
428,154 |
539,067 |
0 |
6,301 |
|
