| Map | Pie | Year | Total | D | R | I | Margin | %Margin | Dem | Rep | Ind | Oth. | Dem | Rep | Ind | Other | | | | | | | | | | | | | | | | | | |
|---|
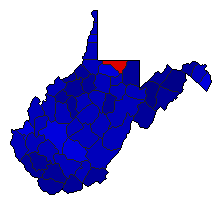 |  | 2020 |
764,048 |
2 |
1 |
0 |
210,452 |
27.54% |
36.23% |
63.77% |
0.00% |
0.00% |
276,798 |
487,250 |
0 |
0 |
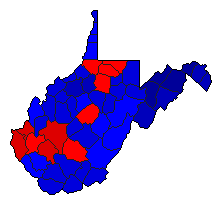 |  | 2016 |
694,154 |
2 |
1 |
0 |
67,192 |
9.68% |
41.95% |
51.63% |
0.00% |
6.41% |
291,232 |
358,424 |
0 |
44,498 |
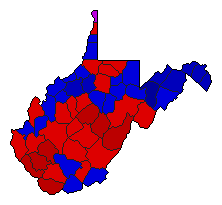 | | 2012 |
643,684 |
2 |
1 |
0 |
16,024 |
2.49% |
48.76% |
51.24% |
0.00% |
0.00% |
313,830 |
329,854 |
0 |
0 |
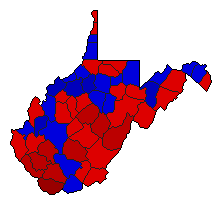 | | 2008 |
678,710 |
1 |
2 |
0 |
5,312 |
0.78% |
50.39% |
49.61% |
0.00% |
0.00% |
342,011 |
336,699 |
0 |
0 |
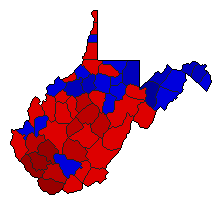 | | 2004 |
713,036 |
1 |
2 |
0 |
5,946 |
0.83% |
50.42% |
49.58% |
0.00% |
0.00% |
359,491 |
353,545 |
0 |
0 |
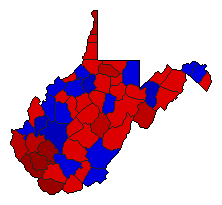 | | 1992 |
596,465 |
1 |
2 |
0 |
18,735 |
3.14% |
51.57% |
48.43% |
0.00% |
0.00% |
307,600 |
288,865 |
0 |
0 |
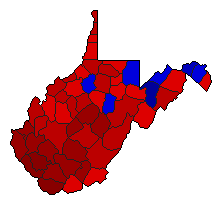 | | 1984 |
681,569 |
1 |
2 |
0 |
187,407 |
27.50% |
63.75% |
36.25% |
0.00% |
0.00% |
434,488 |
247,081 |
0 |
0 |
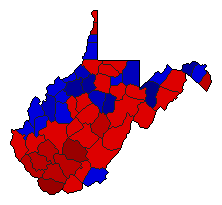 |  | 1952 |
860,820 |
1 |
2 |
0 |
59,686 |
6.93% |
53.47% |
46.53% |
0.00% |
0.00% |
460,253 |
400,567 |
0 |
0 |
|


