| Map | Pie | Office | Total | D | R | I | Margin | %Margin | Dem | Rep | Ind | Oth. | Dem | Rep | Ind | Other | | | | | | | | | | | | | | | | | | |
|---|
 | | Senator |
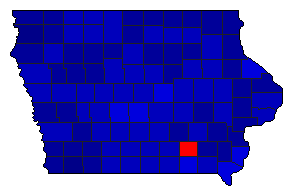
891,762 |
2 |
1 |
3 |
289,474 |
32.46% |
33.57% |
66.04% |
0.38% |
0.01% |
299,406 |
588,880 |
3,370 |
106 |
 | | Governor |
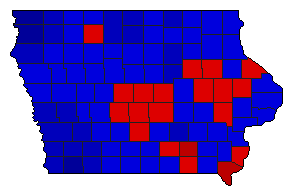
910,623 |
2 |
1 |
0 |
35,725 |
3.92% |
47.99% |
51.91% |
0.00% |
0.10% |
436,987 |
472,712 |
0 |
924 |
 |  | Lt. Governor |
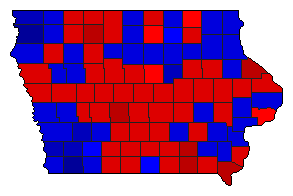
847,615 |
1 |
2 |
3 |
42,890 |
5.06% |
51.56% |
46.50% |
1.93% |
0.02% |
436,999 |
394,109 |
16,360 |
147 |
 |  | Secretary of State |
824,295 |
1 |
2 |
0 |
16,811 |
2.04% |
51.01% |
48.97% |
0.00% |
0.02% |
420,487 |
403,676 |
0 |
132 |
 |  | State Treasurer |
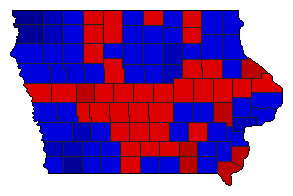
831,253 |
1 |
2 |
0 |
130,087 |
15.65% |
57.82% |
42.17% |
0.00% |
0.01% |
480,636 |
350,549 |
0 |
68 |
 |  | Attorney General |
846,835 |
1 |
2 |
3 |
250,450 |
29.57% |
64.43% |
34.86% |
0.70% |
0.01% |
545,653 |
295,203 |
5,922 |
57 |
 |  | State Auditor |
825,908 |
2 |
1 |
0 |
12,341 |
1.49% |
49.25% |
50.74% |
0.00% |
0.01% |
406,747 |
419,088 |
0 |
73 |
 |  | Agriculture Commissioner |
830,830 |
1 |
2 |
3 |
63,176 |
7.60% |
53.01% |
45.40% |
1.57% |
0.01% |
440,409 |
377,233 |
13,072 |
116 |
|
