| Map | Pie | Office | Total | D | R | I | Margin | %Margin | Dem | Rep | Ind | Oth. | Dem | Rep | Ind | Other | | | | | | | | | | | | | | | | | | |
|---|
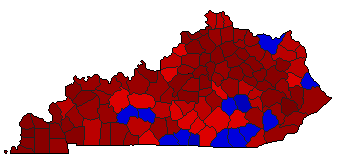
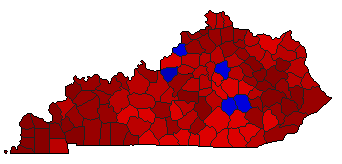 | | Governor |
782,454 |
1 |
2 |
0 |
231,533 |
29.59% |
64.50% |
34.91% |
0.00% |
0.59% |
504,674 |
273,141 |
0 |
4,639 |
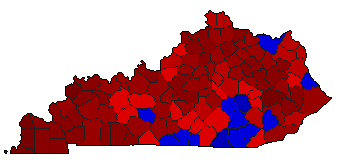
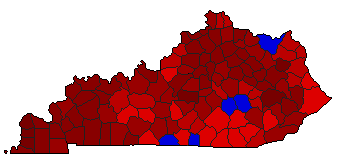 | | Lt. Governor |
704,446 |
1 |
2 |
0 |
331,490 |
47.06% |
73.51% |
26.45% |
0.00% |
0.04% |
517,811 |
186,321 |
0 |
314 |
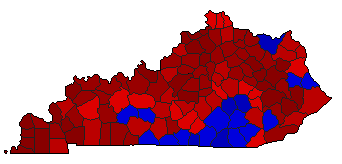 | | Secretary of State |
641,654 |
1 |
2 |
0 |
226,296 |
35.27% |
67.62% |
32.36% |
0.00% |
0.02% |
433,914 |
207,618 |
0 |
122 |
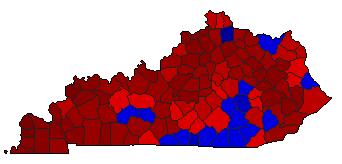
 | | State Treasurer |
637,474 |
1 |
2 |
0 |
208,611 |
32.72% |
66.35% |
33.63% |
0.00% |
0.02% |
422,977 |
214,366 |
0 |
131 |
 | | Attorney General |
653,430 |
1 |
2 |
0 |
260,716 |
39.90% |
69.94% |
30.04% |
0.00% |
0.02% |
457,008 |
196,292 |
0 |
130 |
 | | State Auditor |
644,027 |
1 |
2 |
0 |
253,462 |
39.36% |
69.67% |
30.31% |
0.00% |
0.02% |
448,675 |
195,213 |
0 |
139 |
 | | Agriculture Commissioner |
633,702 |
1 |
2 |
0 |
231,522 |
36.53% |
68.25% |
31.72% |
0.00% |
0.03% |
432,517 |
200,995 |
0 |
190 |
|
