Note: The Google advertisement links below may advocate political positions that this site does not endorse.
| Map | Pie | Office | Total | D | R | I | Margin | %Margin | Dem | Rep | Ind | Oth. | Dem | Rep | Ind | Other | | | | | | | | | | | | | | | | | | |
|---|
| | | Map | Pie | Initiative | Total Vote | N | | Y | Margin | %Margin | No | | Yes | Oth. | No | | Yes | |
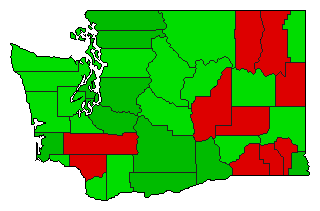 | | Referendum |
1,475,105 |
2 |
0 |
1 |
328,603 |
22.28% |
38.86% |
0.00% |
61.14% |
0.00% |
573,251 |
0 |
901,854 |
0 |
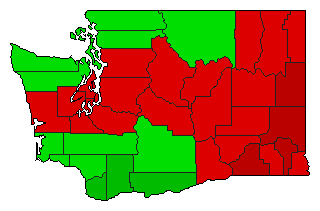 | | Initiative |
1,502,514 |
1 |
0 |
2 |
120,858 |
8.04% |
54.02% |
0.00% |
45.98% |
0.00% |
811,686 |
0 |
690,828 |
0 |
 | | Initiative |
1,502,514 |
1 |
0 |
2 |
120,858 |
8.04% |
54.02% |
0.00% |
45.98% |
0.00% |
811,686 |
0 |
690,828 |
0 |
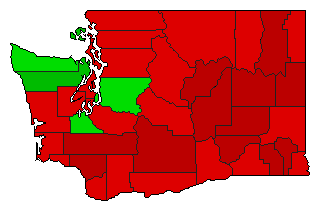 | | Initiative |
1,512,431 |
1 |
0 |
2 |
108,815 |
7.19% |
53.60% |
0.00% |
46.40% |
0.00% |
810,623 |
0 |
701,808 |
0 |
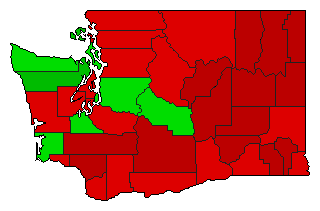 | | Initiative |
1,509,007 |
2 |
0 |
1 |
4,299 |
0.28% |
49.86% |
0.00% |
50.14% |
0.00% |
752,354 |
0 |
756,653 |
0 |
|
