| Map | Pie | Office | Total | D | R | I | Margin | %Margin | Dem | Rep | Ind | Oth. | Dem | Rep | Ind | Other | | | | | | | | | | | | | | | | | | |
|---|
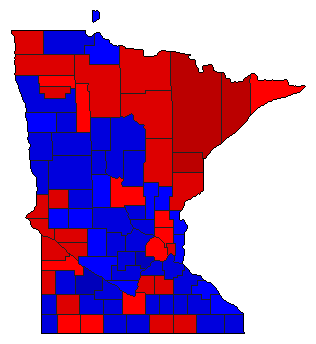
 |  | Senator |
1,772,929 |
2 |
1 |
3 |
87,793 |
4.95% |
44.10% |
49.05% |
5.38% |
1.47% |
781,860 |
869,653 |
95,400 |
26,016 |
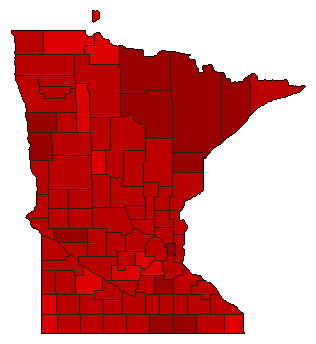
 |  | Governor |
1,727,394 |
2 |
1 |
0 |
504,821 |
29.22% |
34.12% |
63.34% |
0.00% |
2.54% |
589,344 |
1,094,165 |
0 |
43,885 |
 |  | Secretary of State |
1,729,140 |
1 |
2 |
0 |
401,779 |
23.24% |
60.06% |
36.82% |
0.00% |
3.12% |
1,038,455 |
636,676 |
0 |
54,009 |
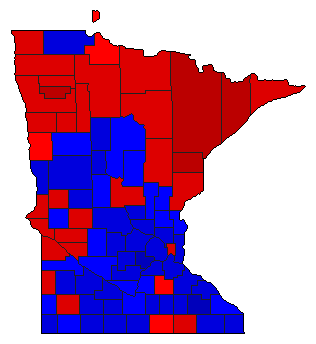
 |  | State Treasurer |
1,623,399 |
1 |
2 |
0 |
20,403 |
1.26% |
48.03% |
46.77% |
0.00% |
5.20% |
779,658 |
759,255 |
0 |
84,486 |
 |  | Attorney General |
1,673,841 |
1 |
2 |
0 |
626,559 |
37.43% |
66.63% |
29.20% |
0.00% |
4.17% |
1,115,312 |
488,753 |
0 |
69,776 |
 |  | State Auditor |
1,686,067 |
2 |
1 |
0 |
67,996 |
4.03% |
45.59% |
49.62% |
0.00% |
4.79% |
768,630 |
836,626 |
0 |
80,811 |
| | | Map | Pie | Initiative | Total Vote | N | | Y | Margin | %Margin | No | | Yes | Oth. | No | | Yes | |
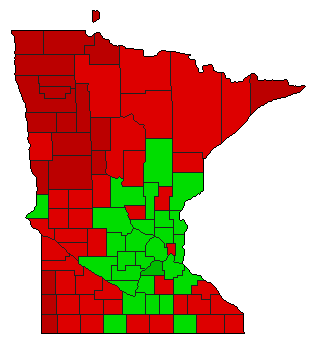 |  | Amendment |
1,689,079 |
1 |
0 |
2 |
6,525 |
0.39% |
50.19% |
0.00% |
49.81% |
0.00% |
847,802 |
0 |
841,277 |
0 |
|
