| Map | Pie | Office | Total | D | R | I | Margin | %Margin | Dem | Rep | Ind | Oth. | Dem | Rep | Ind | Other | | | | | | | | | | | | | | | | | | |
|---|
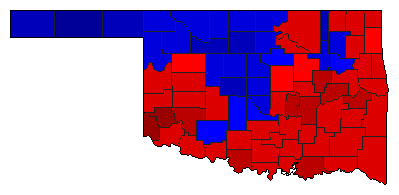
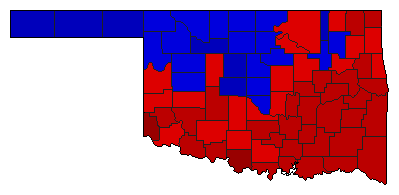
 |  | Senator (S) |
982,430 |
2 |
1 |
3 |
149,902 |
15.26% |
39.95% |
55.21% |
4.84% |
0.00% |
392,488 |
542,390 |
47,552 |
0 |
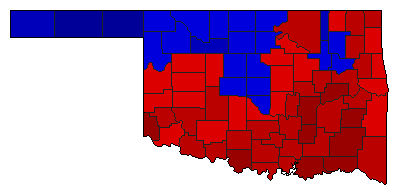
 |  | Governor |
995,012 |
2 |
1 |
3 |
171,804 |
17.27% |
29.64% |
46.91% |
23.45% |
0.00% |
294,936 |
466,740 |
233,336 |
0 |
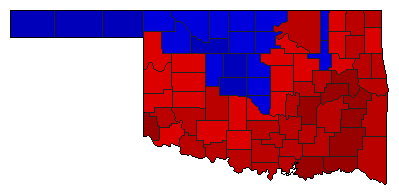
 | | Lt. Governor |
985,138 |
2 |
1 |
3 |
54,324 |
5.51% |
44.18% |
49.69% |
6.13% |
0.00% |
435,215 |
489,539 |
60,384 |
0 |
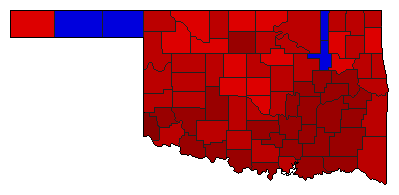
 | | State Treasurer |
966,665 |
1 |
2 |
0 |
33,457 |
3.46% |
51.73% |
48.27% |
0.00% |
0.00% |
500,061 |
466,604 |
0 |
0 |
 | | Attorney General |
972,070 |
1 |
2 |
0 |
42,008 |
4.32% |
52.16% |
47.84% |
0.00% |
0.00% |
507,039 |
465,031 |
0 |
0 |
 | | State Auditor |
959,199 |
1 |
2 |
0 |
197,489 |
20.59% |
60.29% |
39.71% |
0.00% |
0.00% |
578,344 |
380,855 |
0 |
0 |
 | | Insurance Commissioner |
958,887 |
2 |
1 |
0 |
13,165 |
1.37% |
49.31% |
50.69% |
0.00% |
0.00% |
472,861 |
486,026 |
0 |
0 |
|
