| Map | Pie | Year | Total | D | R | I | Margin | %Margin | Dem | Rep | Ind | Oth. | Dem | Rep | Ind | Other | | | | | | | | | | | | | | | | | | |
|---|
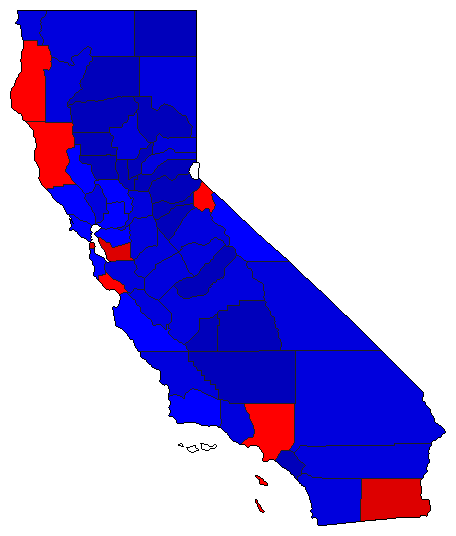
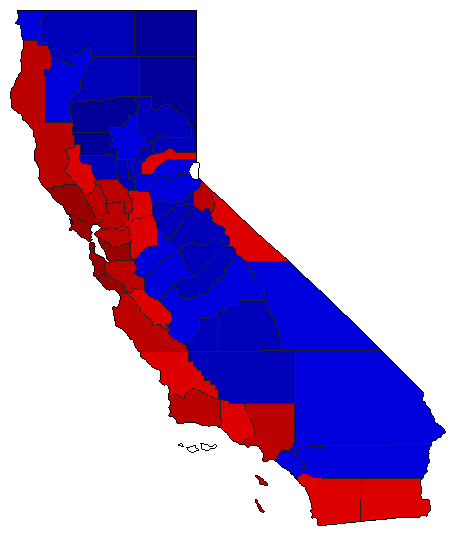 |  | 2022 |
10,605,297 |
1 |
2 |
0 |
2,106,523 |
19.86% |
59.93% |
40.07% |
0.00% |
0.00% |
6,355,910 |
4,249,387 |
0 |
0 |
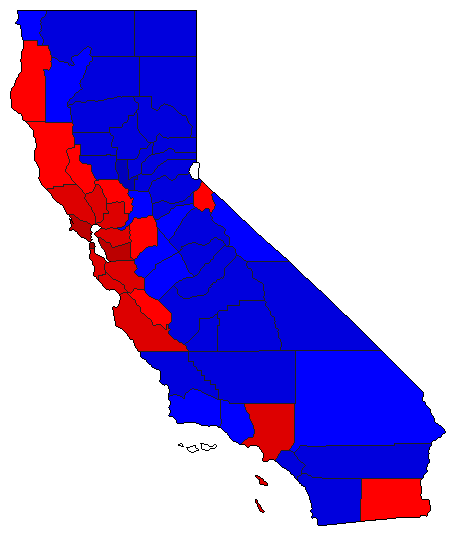
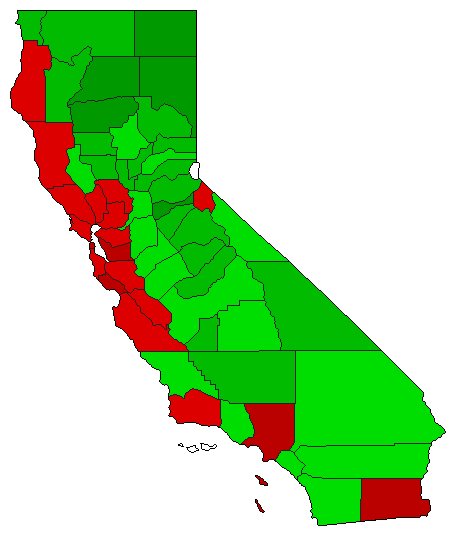 |  | 2018 |
10,309,558 |
1 |
0 |
2 |
415,712 |
4.03% |
52.02% |
0.00% |
47.98% |
0.00% |
5,362,635 |
0 |
4,946,923 |
0 |
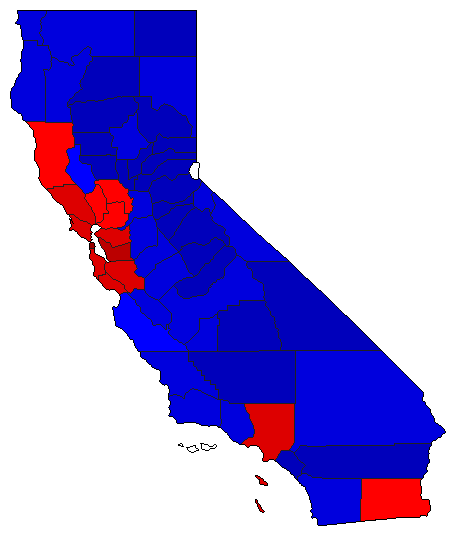
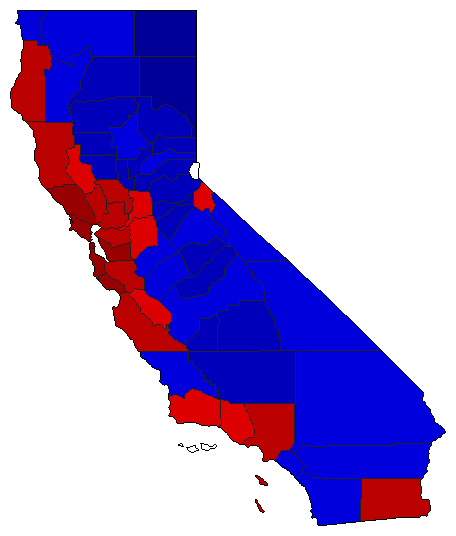 | | 2014 |
7,020,116 |
1 |
2 |
0 |
1,056,214 |
15.05% |
57.52% |
42.48% |
0.00% |
0.00% |
4,038,165 |
2,981,951 |
0 |
0 |
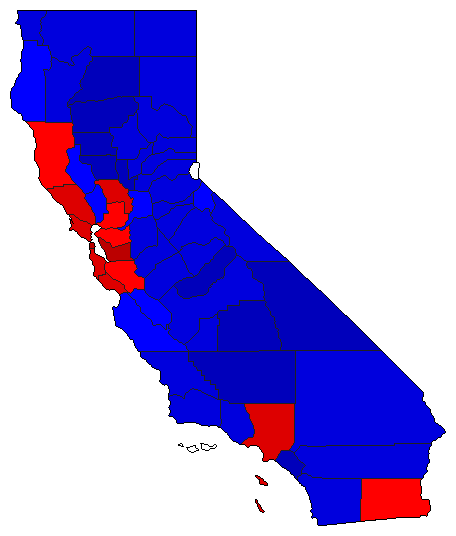
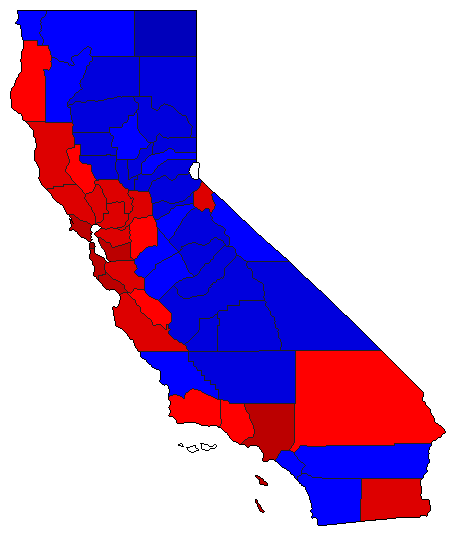 | | 2010 |
9,422,852 |
1 |
2 |
0 |
1,224,774 |
13.00% |
50.57% |
37.57% |
0.00% |
11.85% |
4,765,400 |
3,540,626 |
0 |
1,116,826 |
 | | 2006 |
8,329,397 |
2 |
1 |
0 |
1,029,450 |
12.36% |
38.47% |
50.83% |
0.00% |
10.70% |
3,204,536 |
4,233,986 |
0 |
890,875 |
 | | 2002 |
7,200,429 |
1 |
2 |
0 |
348,694 |
4.84% |
46.48% |
41.64% |
0.00% |
11.88% |
3,346,937 |
2,998,243 |
0 |
855,249 |
 | | 1998 |
8,036,037 |
2 |
1 |
0 |
487,309 |
6.06% |
43.80% |
49.86% |
0.00% |
6.34% |
3,519,453 |
4,006,762 |
0 |
509,822 |
 | | 1994 |
8,225,487 |
2 |
1 |
0 |
447,862 |
5.44% |
43.38% |
48.82% |
0.00% |
7.80% |
3,567,996 |
4,015,858 |
0 |
641,633 |
 | | 1990 |
7,220,508 |
1 |
2 |
0 |
1,034,140 |
14.32% |
52.22% |
37.90% |
0.00% |
9.88% |
3,770,717 |
2,736,577 |
0 |
713,214 |
|
