| Map | Pie | Year | Total | D | R | I | Margin | %Margin | Dem | Rep | Ind | Oth. | Dem | Rep | Ind | Other | | | | | | | | | | | | | | | | | | |
|---|
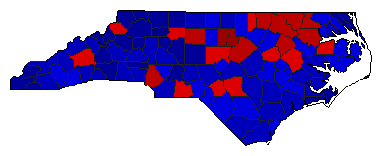 |  | 2020 |
5,424,113 |
2 |
1 |
0 |
177,197 |
3.27% |
48.37% |
51.63% |
0.00% |
0.00% |
2,623,458 |
2,800,655 |
0 |
0 |
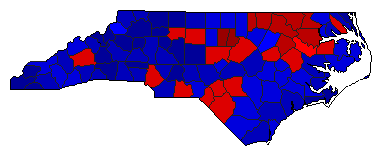 |  | 2016 |
4,619,680 |
2 |
1 |
0 |
300,128 |
6.50% |
45.32% |
51.81% |
0.00% |
2.87% |
2,093,449 |
2,393,577 |
0 |
132,654 |
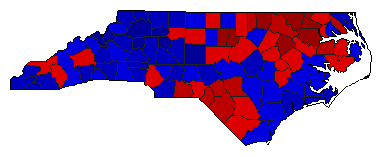 | | 2012 |
4,369,251 |
2 |
1 |
0 |
6,307 |
0.14% |
49.93% |
50.07% |
0.00% |
0.00% |
2,181,472 |
2,187,779 |
0 |
0 |
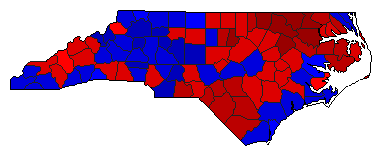 | | 2008 |
4,173,985 |
1 |
2 |
3 |
218,029 |
5.22% |
51.10% |
45.88% |
3.02% |
0.00% |
2,132,970 |
1,914,941 |
126,074 |
0 |
 | | 2004 |
3,398,470 |
1 |
2 |
3 |
434,692 |
12.79% |
55.57% |
42.78% |
1.66% |
0.00% |
1,888,397 |
1,453,705 |
56,368 |
0 |
 | | 2000 |
2,866,383 |
1 |
2 |
0 |
184,381 |
6.43% |
52.34% |
45.91% |
0.00% |
1.76% |
1,500,206 |
1,315,825 |
0 |
50,352 |
 | | 1996 |
2,458,372 |
1 |
2 |
0 |
245,362 |
9.98% |
54.50% |
44.52% |
0.00% |
0.97% |
1,339,893 |
1,094,531 |
0 |
23,948 |
 |  | 1984 |
2,139,942 |
1 |
2 |
0 |
158,486 |
7.41% |
53.70% |
46.30% |
0.00% |
0.00% |
1,149,214 |
990,728 |
0 |
0 |
 |  | 1968 |
1,448,598 |
1 |
2 |
0 |
155,312 |
10.72% |
55.36% |
44.64% |
0.00% |
0.00% |
801,955 |
646,643 |
0 |
0 |
|
