| Map | Pie | Year | Total | D | R | I | Margin | %Margin | Dem | Rep | Ind | Oth. | Dem | Rep | Ind | Other | | | | | | | | | | | | | | | | | | |
|---|
 |  | 2020 |
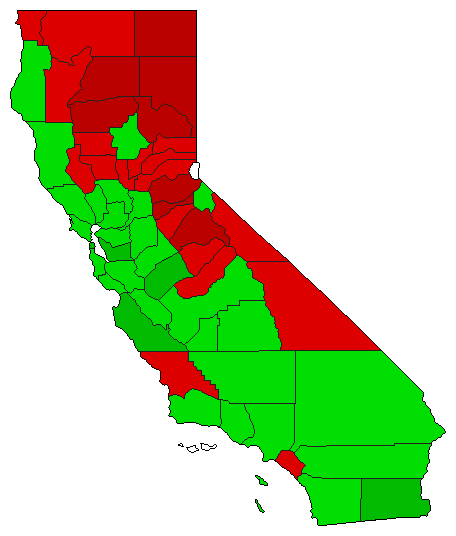
17,054,741 |
2 |
0 |
1 |
2,916,395 |
17.10% |
41.45% |
0.00% |
58.55% |
0.00% |
7,069,173 |
0 |
9,985,568 |
0 |
 |  | 2016 |
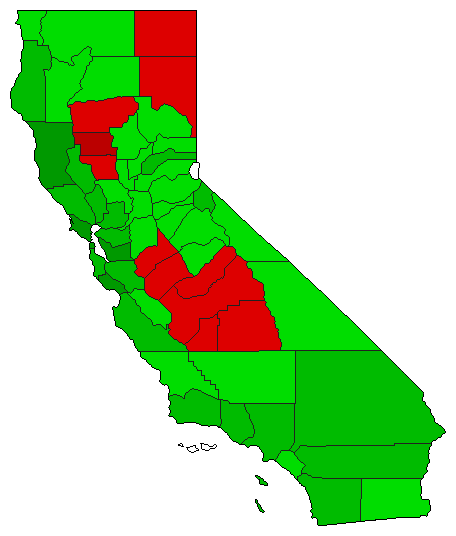
13,620,436 |
2 |
0 |
1 |
1,411,848 |
10.37% |
44.82% |
0.00% |
55.18% |
0.00% |
6,104,294 |
0 |
7,516,142 |
0 |
 | | 2008 |
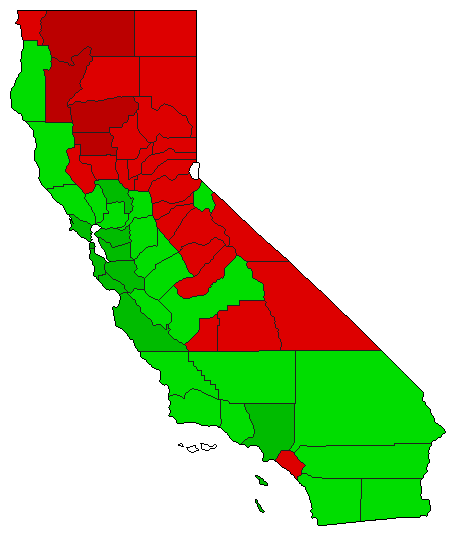
12,935,507 |
2 |
0 |
1 |
3,472,031 |
26.84% |
36.58% |
0.00% |
63.42% |
0.00% |
4,731,738 |
0 |
8,203,769 |
0 |
 | | 2006 |
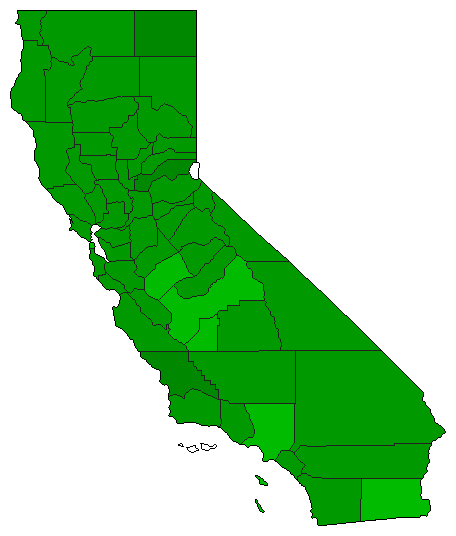
8,356,923 |
2 |
0 |
1 |
1,152,813 |
13.79% |
43.10% |
0.00% |
56.90% |
0.00% |
3,602,055 |
0 |
4,754,868 |
0 |
 | | 2004 |
10,619,809 |
2 |
0 |
1 |
4,932,939 |
46.45% |
26.77% |
0.00% |
73.23% |
0.00% |
2,843,435 |
0 |
7,776,374 |
0 |
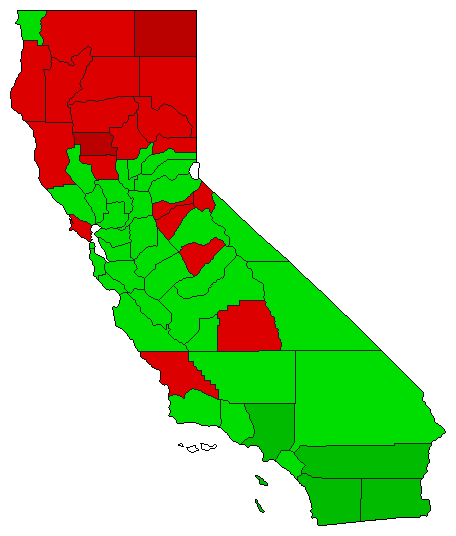 | | 2002 |
7,109,026 |
2 |
0 |
1 |
940,782 |
13.23% |
43.38% |
0.00% |
56.62% |
0.00% |
3,084,122 |
0 |
4,024,904 |
0 |
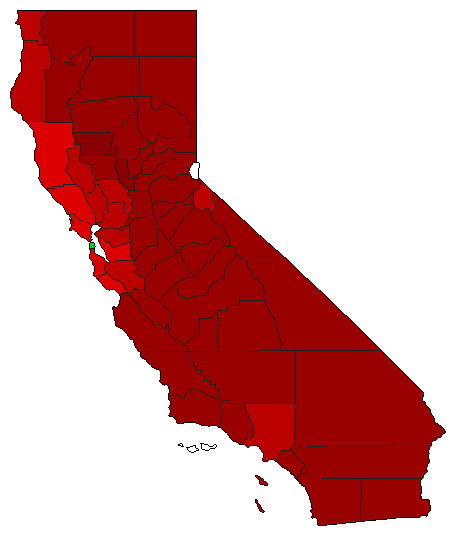 | | 2000 |
7,084,648 |
1 |
0 |
2 |
2,619,808 |
36.98% |
68.49% |
0.00% |
31.51% |
0.00% |
4,852,228 |
0 |
2,232,420 |
0 |
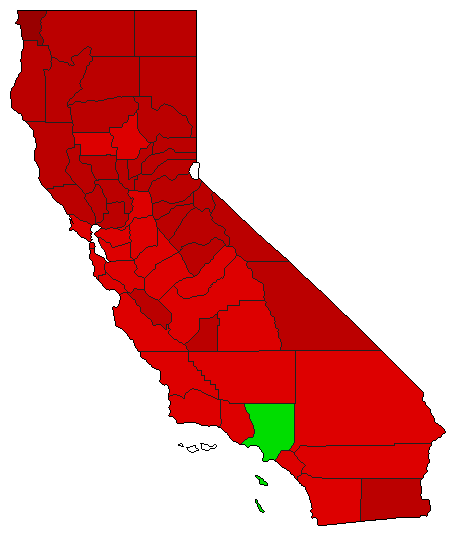 | | 1998 |
7,421,009 |
1 |
0 |
2 |
570,327 |
7.69% |
53.84% |
0.00% |
46.16% |
0.00% |
3,995,668 |
0 |
3,425,341 |
0 |
|


