| Map | Pie | Year | Total | D | R | I | Margin | %Margin | Dem | Rep | Ind | Oth. | Dem | Rep | Ind | Other | | | | | | | | | | | | | | | | | | |
|---|
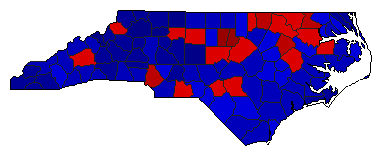 |  | 2020 |
5,387,570 |
2 |
1 |
0 |
416,126 |
7.72% |
46.14% |
53.86% |
0.00% |
0.00% |
2,485,722 |
2,901,848 |
0 |
0 |
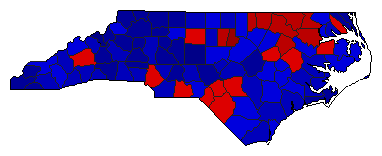 |  | 2016 |
4,543,317 |
2 |
1 |
0 |
505,573 |
11.13% |
44.44% |
55.56% |
0.00% |
0.00% |
2,018,872 |
2,524,445 |
0 |
0 |
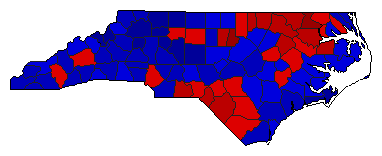 | | 2012 |
4,328,640 |
2 |
1 |
0 |
278,532 |
6.43% |
46.78% |
53.22% |
0.00% |
0.00% |
2,025,054 |
2,303,586 |
0 |
0 |
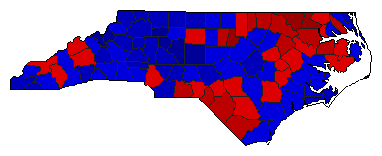 | | 2008 |
4,092,887 |
2 |
1 |
0 |
167,405 |
4.09% |
47.95% |
52.05% |
0.00% |
0.00% |
1,962,741 |
2,130,146 |
0 |
0 |
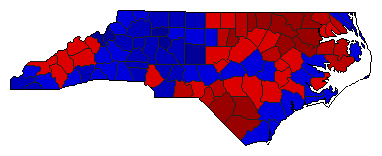 |  | 2004 |
3,330,107 |
2 |
1 |
0 |
2,287 |
0.07% |
49.97% |
50.03% |
0.00% |
0.00% |
1,663,910 |
1,666,197 |
0 |
0 |
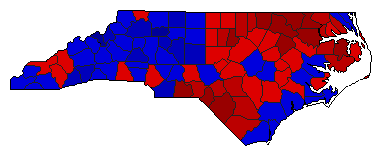 |  | 2000 |
2,804,475 |
1 |
2 |
0 |
31,853 |
1.14% |
50.57% |
49.43% |
0.00% |
0.00% |
1,418,164 |
1,386,311 |
0 |
0 |
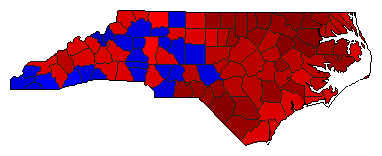 |  | 1996 |
2,439,294 |
1 |
2 |
4 |
429,577 |
17.61% |
57.80% |
40.18% |
0.99% |
1.03% |
1,409,801 |
980,224 |
24,217 |
25,052 |
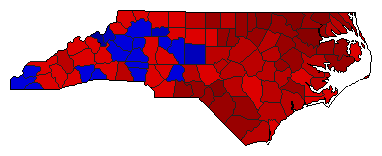 |  | 1984 |
2,045,680 |
1 |
2 |
0 |
360,222 |
17.61% |
58.80% |
41.20% |
0.00% |
0.00% |
1,202,951 |
842,729 |
0 |
0 |
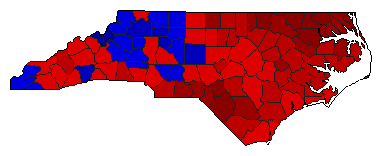 |  | 1968 |
1,408,211 |
1 |
2 |
0 |
166,147 |
11.80% |
55.90% |
44.10% |
0.00% |
0.00% |
787,179 |
621,032 |
0 |
0 |
|


