| Map | Pie | Office | Total | D | R | I | Margin | %Margin | Dem | Rep | Ind | Oth. | Dem | Rep | Ind | Other | | | | | | | | | | | | | | | | | | |
|---|
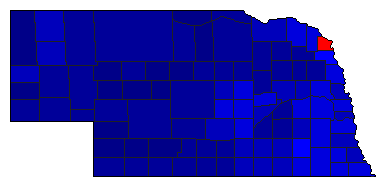
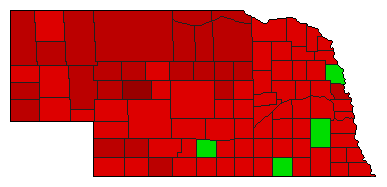
 |  | Senator |
592,316 |
1 |
2 |
0 |
164,460 |
27.77% |
63.88% |
36.12% |
0.00% |
0.00% |
378,388 |
213,928 |
0 |
0 |
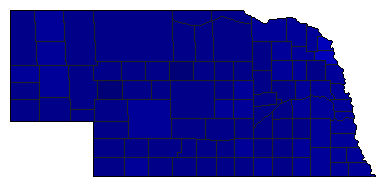
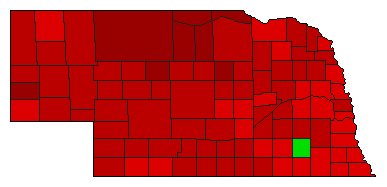
 |  | Governor |
593,357 |
2 |
1 |
4 |
290,392 |
48.94% |
24.46% |
73.40% |
0.64% |
1.51% |
145,115 |
435,507 |
3,782 |
8,953 |
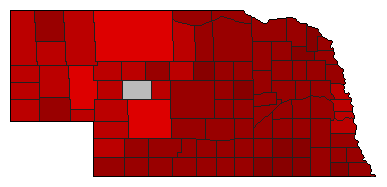
 | | Secretary of State |
549,860 |
2 |
1 |
0 |
152,505 |
27.74% |
33.59% |
61.32% |
0.00% |
5.09% |
184,684 |
337,189 |
0 |
27,987 |
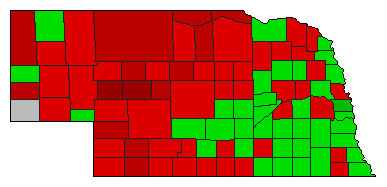
 | | State Treasurer |
538,045 |
0 |
1 |
0 |
282,873 |
52.57% |
0.00% |
76.29% |
0.00% |
23.71% |
0 |
410,459 |
0 |
127,586 |
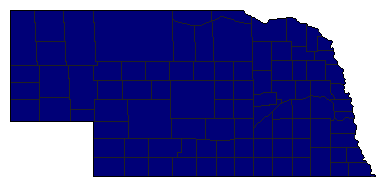 |  | Attorney General |
477,691 |
0 |
1 |
0 |
477,691 |
100.00% |
0.00% |
100.00% |
0.00% |
0.00% |
0 |
477,691 |
0 |
0 |
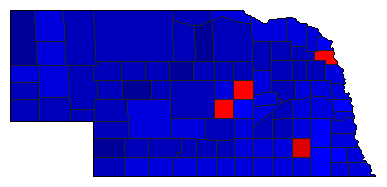 | | State Auditor |
544,939 |
2 |
1 |
0 |
76,356 |
14.01% |
39.31% |
53.32% |
0.00% |
7.37% |
214,208 |
290,564 |
0 |
40,167 |
| | | Map | Pie | Initiative | Total Vote | N | | Y | Margin | %Margin | No | | Yes | Oth. | No | | Yes | |
 | | Referendum |
525,006 |
1 |
0 |
2 |
35,936 |
6.84% |
53.42% |
0.00% |
46.58% |
0.00% |
280,471 |
0 |
244,535 |
0 |
 | | Initiative |
575,452 |
1 |
0 |
2 |
127,088 |
22.08% |
61.04% |
0.00% |
38.96% |
0.00% |
351,270 |
0 |
224,182 |
0 |
 | | Initiative |
579,278 |
1 |
0 |
2 |
233,560 |
40.32% |
70.16% |
0.00% |
29.84% |
0.00% |
406,419 |
0 |
172,859 |
0 |
 | | Initiative |
535,442 |
2 |
0 |
1 |
47,466 |
8.86% |
45.57% |
0.00% |
54.43% |
0.00% |
243,988 |
0 |
291,454 |
0 |
|
