| Map | Pie | Office | Total | D | R | I | Margin | %Margin | Dem | Rep | Ind | Oth. | Dem | Rep | Ind | Other | | | | | | | | | | | | | | | | | | |
|---|
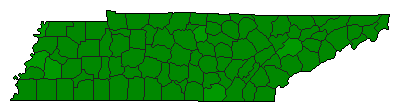
 |  | Senator |
1,833,695 |
2 |
1 |
0 |
49,935 |
2.72% |
47.99% |
50.71% |
0.00% |
1.30% |
879,976 |
929,911 |
0 |
23,808 |
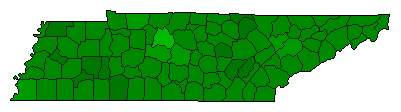
 |  | Governor |
1,818,549 |
1 |
2 |
0 |
706,638 |
38.86% |
68.60% |
29.74% |
0.00% |
1.66% |
1,247,491 |
540,853 |
0 |
30,205 |
| | | Map | Pie | Initiative | Total Vote | N | | Y | Margin | %Margin | No | | Yes | Oth. | No | | Yes | |
 | | Initiative |
1,746,970 |
2 |
0 |
1 |
1,091,898 |
62.50% |
18.75% |
0.00% |
81.25% |
0.00% |
327,536 |
0 |
1,419,434 |
0 |
 | | Initiative |
1,639,812 |
2 |
0 |
1 |
1,083,552 |
66.08% |
16.96% |
0.00% |
83.04% |
0.00% |
278,130 |
0 |
1,361,682 |
0 |
|
