| Map | Pie | Office | Total | D | R | I | Margin | %Margin | Dem | Rep | Ind | Oth. | Dem | Rep | Ind | Other | | | | | | | | | | | | | | | | | | |
|---|
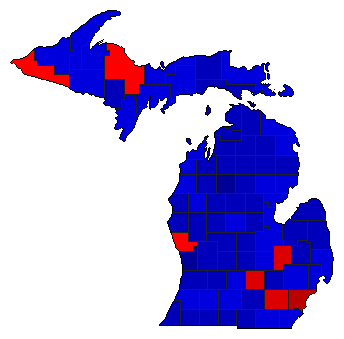
 |  | Governor |
3,226,088 |
2 |
1 |
0 |
587,514 |
18.21% |
39.90% |
58.11% |
0.00% |
1.98% |
1,287,320 |
1,874,834 |
0 |
63,934 |
 | | Secretary of State |
3,173,248 |
2 |
1 |
5 |
173,474 |
5.47% |
45.22% |
50.68% |
0.96% |
3.14% |
1,434,796 |
1,608,270 |
30,411 |
99,771 |
 | | Attorney General |
3,136,224 |
2 |
1 |
4 |
285,737 |
9.11% |
43.48% |
52.59% |
1.94% |
2.00% |
1,363,486 |
1,649,223 |
60,778 |
62,737 |
| | | Map | Pie | Initiative | Total Vote | N | | Y | Margin | %Margin | No | | Yes | Oth. | No | | Yes | |
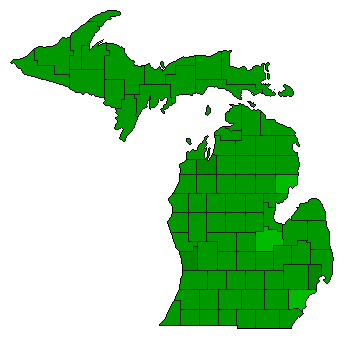
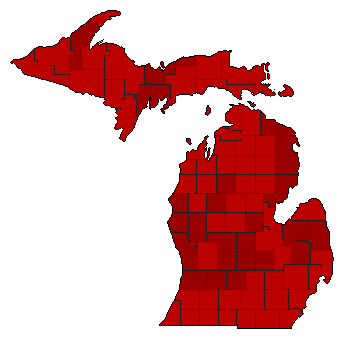 | | Referendum |
2,943,592 |
1 |
0 |
2 |
977,554 |
33.21% |
66.60% |
0.00% |
33.40% |
0.00% |
1,960,573 |
0 |
983,019 |
0 |
 | | Referendum |
3,031,243 |
2 |
0 |
1 |
1,510,071 |
49.82% |
25.09% |
0.00% |
74.91% |
0.00% |
760,586 |
0 |
2,270,657 |
0 |
|
