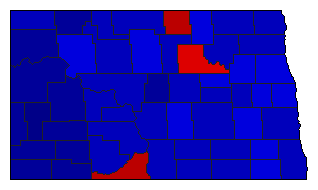
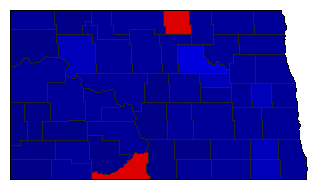
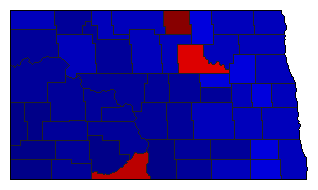
2010 General Election Results Comparison - North Dakota
Note: The Google advertisement links below may advocate political positions that this site does not endorse.
MapPieOfficeTotalDRIMargin%MarginDemRepIndOth.DemRepIndOther 
                 
MapMapSenator 238,812 2 1 0 128,734 53.91% 22.17% 76.08% 0.00% 1.75% 52,955 181,689 0 4,168
MapSecretary of State 233,623 2 1 0 58,363 24.98% 37.46% 62.44% 0.00% 0.10% 87,519 145,882 0 222
MapAttorney General 235,582 2 1 0 115,846 49.17% 25.38% 74.55% 0.00% 0.07% 59,781 175,627 0 174
MapMapAgriculture Commissioner 232,010 2 1 0 83,724 36.09% 31.96% 68.04% 0.00% 0.00% 74,143 157,867 0 0

North Dakota Results for 2010

Login

Terms of Use - DCMA Policy - Privacy Policy and Cookies


© Dave Leip's Atlas of U.S. Elections, LLC 2019 All Rights Reserved