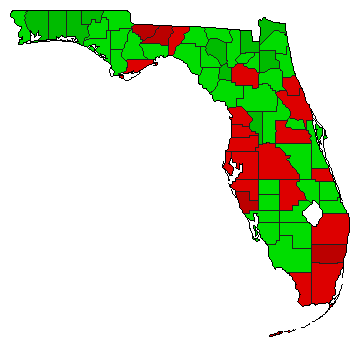
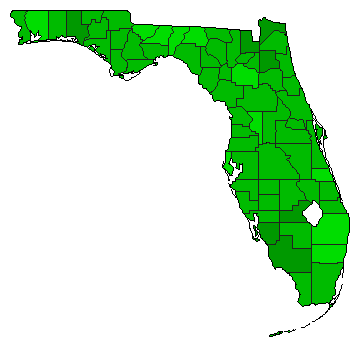
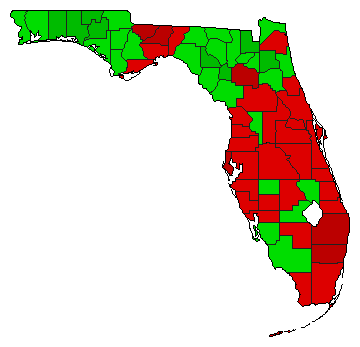
| Map | Pie | Office | Total | D | R | I | Margin | %Margin | Dem | Rep | Ind | Oth. | Dem | Rep | Ind | Other | | | | | | | | | | | | | | | | | | |
|---|
 |  | President |
8,492,175 |
1 |
2 |
- |
74,309 |
0.88% |
49.90% |
49.03% |
0.00% |
1.07% |
4,237,756 |
4,163,447 |
0 |
90,972 |
 |  | Senator |
8,189,946 |
1 |
2 |
3 |
1,065,184 |
13.01% |
55.23% |
42.23% |
1.54% |
1.00% |
4,523,451 |
3,458,267 |
126,079 |
82,149 |
| | | Map | Pie | Initiative | Total Vote | N | | Y | Margin | %Margin | No | | Yes | Oth. | No | | Yes | |
 | | Referendum |
7,488,923 |
1 |
0 |
2 |
224,293 |
2.99% |
51.50% |
0.00% |
48.50% |
0.00% |
3,856,608 |
0 |
3,632,315 |
0 |
 | | Referendum |
7,758,221 |
2 |
0 |
1 |
2,056,461 |
26.51% |
36.75% |
0.00% |
63.25% |
0.00% |
2,850,880 |
0 |
4,907,341 |
0 |
 |  | Initiative |
7,819,762 |
1 |
0 |
2 |
797,054 |
10.19% |
55.10% |
0.00% |
44.90% |
0.00% |
4,308,408 |
0 |
3,511,354 |
0 |
|