| Map | Pie | Year | Total | D | R | I | Margin | %Margin | Dem | Rep | Ind | Oth. | Dem | Rep | Ind | Other | | | | | | | | | | | | | | | | | | |
|---|
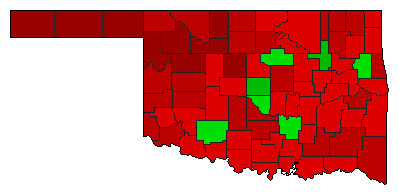 |  | 2020 |
674,591 |
2 |
0 |
1 |
6,553 |
0.97% |
49.51% |
0.00% |
50.49% |
0.00% |
334,019 |
0 |
340,572 |
0 |
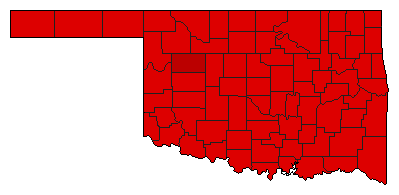 |  | 2018 |
1,151,477 |
1 |
0 |
2 |
94,249 |
8.19% |
54.09% |
0.00% |
45.91% |
0.00% |
622,863 |
0 |
528,614 |
0 |
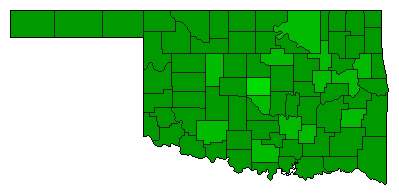 |  | 2016 |
1,418,393 |
2 |
0 |
1 |
464,279 |
32.73% |
33.63% |
0.00% |
66.37% |
0.00% |
477,057 |
0 |
941,336 |
0 |
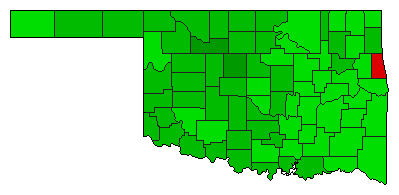 | | 2012 |
1,260,017 |
2 |
0 |
1 |
231,691 |
18.39% |
40.81% |
0.00% |
59.19% |
0.00% |
514,163 |
0 |
745,854 |
0 |
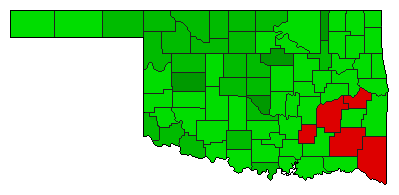 | | 1992 |
1,287,611 |
2 |
0 |
1 |
356,787 |
27.71% |
36.15% |
0.00% |
63.85% |
0.00% |
465,412 |
0 |
822,199 |
0 |
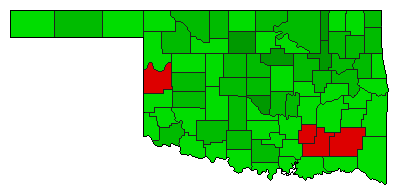 | | 1978 |
672,458 |
2 |
0 |
1 |
217,616 |
32.36% |
33.82% |
0.00% |
66.18% |
0.00% |
227,421 |
0 |
445,037 |
0 |
|