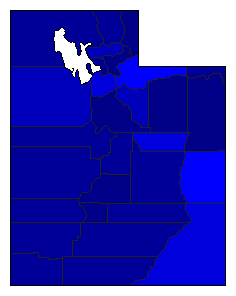
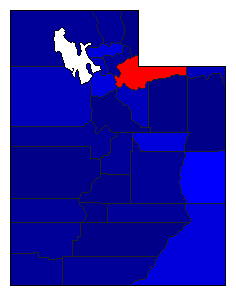
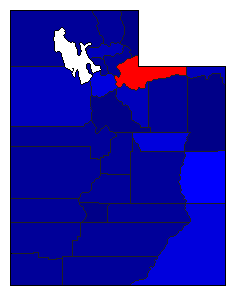
| Map | Pie | Office | Total | D | R | I | Margin | %Margin | Dem | Rep | Ind | Oth. | Dem | Rep | Ind | Other | | | | | | | | | | | | | | | | | | |
|---|
 |  | President |
1,020,861 |
2 |
1 |
- |
488,787 |
47.88% |
24.67% |
72.55% |
0.00% |
2.79% |
251,813 |
740,600 |
0 |
28,448 |
 |  | Senator |
1,006,901 |
2 |
1 |
5 |
355,735 |
35.33% |
29.98% |
65.31% |
0.71% |
4.00% |
301,873 |
657,608 |
7,172 |
40,248 |
 |  | Governor |
1,006,524 |
2 |
1 |
0 |
410,970 |
40.83% |
27.58% |
68.41% |
0.00% |
4.00% |
277,622 |
688,592 |
0 |
40,310 |
 |  | State Treasurer |
969,020 |
2 |
1 |
3 |
378,423 |
39.05% |
27.93% |
66.98% |
5.09% |
0.00% |
270,638 |
649,061 |
49,308 |
13 |
 | | Attorney General |
986,827 |
2 |
1 |
3 |
343,175 |
34.78% |
29.93% |
64.70% |
5.37% |
0.00% |
295,317 |
638,492 |
53,018 |
0 |
 |  | State Auditor |
969,100 |
2 |
1 |
3 |
350,135 |
36.13% |
29.33% |
65.46% |
5.21% |
0.00% |
284,238 |
634,373 |
50,489 |
0 |
|