| Map | Pie | Office | Total | D | R | I | Margin | %Margin | Dem | Rep | Ind | Oth. | Dem | Rep | Ind | Other | | | | | | | | | | | | | | | | | | |
|---|
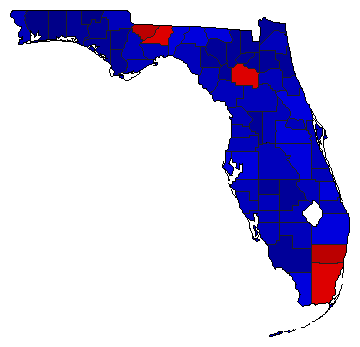
 |  | Governor |
5,951,561 |
2 |
1 |
4 |
64,145 |
1.08% |
47.07% |
48.14% |
0.69% |
4.09% |
2,801,198 |
2,865,343 |
41,341 |
243,679 |
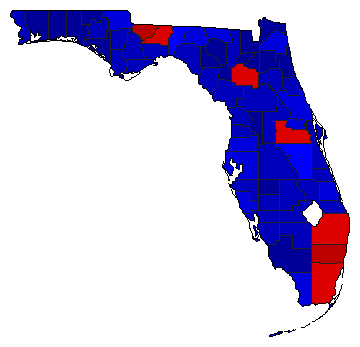
 | | State Treasurer |
5,691,624 |
2 |
1 |
0 |
1,016,170 |
17.85% |
41.07% |
58.93% |
0.00% |
0.00% |
2,337,727 |
3,353,897 |
0 |
0 |
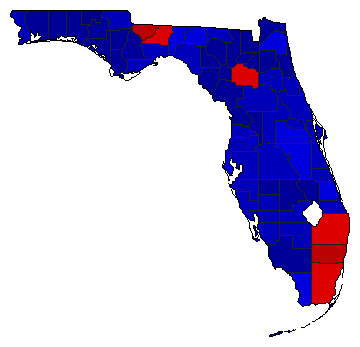
 | | Attorney General |
5,849,235 |
2 |
1 |
3 |
765,207 |
13.08% |
42.01% |
55.09% |
2.90% |
0.00% |
2,457,317 |
3,222,524 |
169,394 |
0 |
 | | Agriculture Commissioner |
5,689,426 |
2 |
1 |
0 |
986,572 |
17.34% |
41.33% |
58.67% |
0.00% |
0.00% |
2,351,427 |
3,337,999 |
0 |
0 |
| | | Map | Pie | Initiative | Total Vote | N | | Y | Margin | %Margin | No | | Yes | Oth. | No | | Yes | |
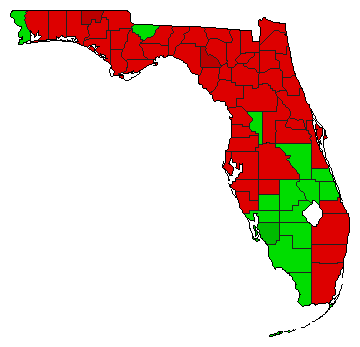 | | Referendum |
5,379,278 |
1 |
0 |
2 |
225,804 |
4.20% |
52.10% |
0.00% |
47.90% |
0.00% |
2,802,541 |
0 |
2,576,737 |
0 |
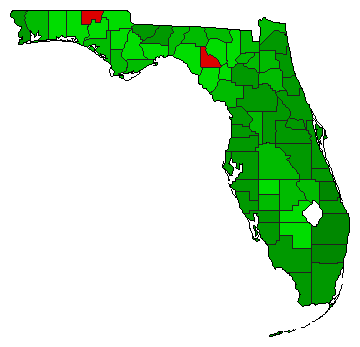 | | Referendum |
5,654,663 |
2 |
0 |
1 |
2,822,815 |
49.92% |
25.04% |
0.00% |
74.96% |
0.00% |
1,415,924 |
0 |
4,238,739 |
0 |
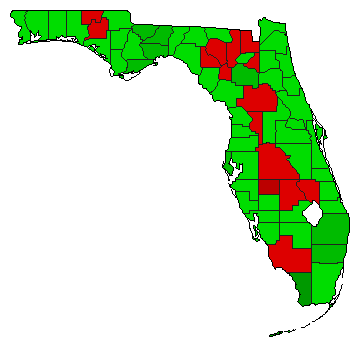 | | Referendum |
5,849,754 |
2 |
0 |
1 |
891,768 |
15.24% |
42.38% |
0.00% |
57.62% |
0.00% |
2,478,993 |
0 |
3,370,761 |
0 |
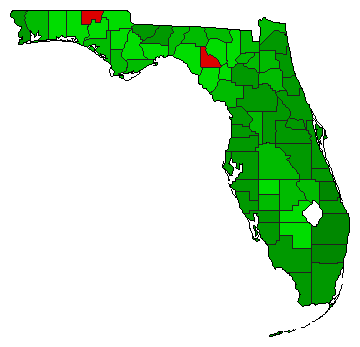 | | Initiative |
5,654,663 |
2 |
0 |
1 |
2,822,815 |
49.92% |
25.04% |
0.00% |
74.96% |
0.00% |
1,415,924 |
0 |
4,238,739 |
0 |
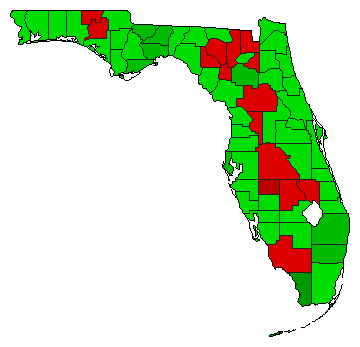 | | Initiative |
5,849,754 |
2 |
0 |
1 |
891,768 |
15.24% |
42.38% |
0.00% |
57.62% |
0.00% |
2,478,993 |
0 |
3,370,761 |
0 |
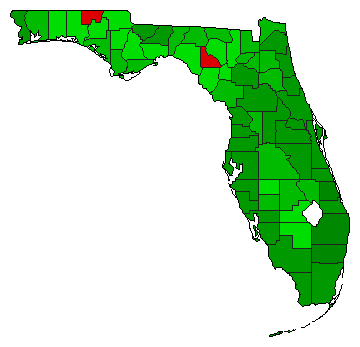 | | Amendment |
5,654,663 |
2 |
0 |
1 |
2,822,815 |
49.92% |
25.04% |
0.00% |
74.96% |
0.00% |
1,415,924 |
0 |
4,238,739 |
0 |
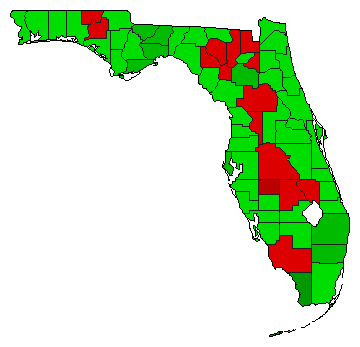 | | Amendment |
5,849,754 |
2 |
0 |
1 |
891,768 |
15.24% |
42.38% |
0.00% |
57.62% |
0.00% |
2,478,993 |
0 |
3,370,761 |
0 |
|