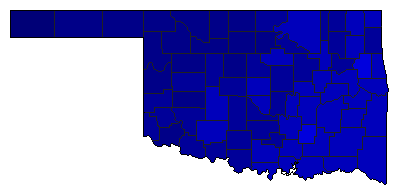
Note: The Google advertisement links below may advocate political positions that this site does not endorse.
| Map | Pie | Office | Total | D | R | I | Margin | %Margin | Dem | Rep | Ind | Oth. | Dem | Rep | Ind | Other | | | | | | | | | | | | | | | | | | |
|---|
 |  | Senator |
820,733 |
2 |
1 |
3 |
323,859 |
39.46% |
28.55% |
68.01% |
1.29% |
2.16% |
234,307 |
558,166 |
10,554 |
17,706 |
 |  | Senator (S) |
820,890 |
2 |
1 |
3 |
319,079 |
38.87% |
28.98% |
67.85% |
3.16% |
0.00% |
237,923 |
557,002 |
25,965 |
0 |
 |  | Governor |
824,831 |
2 |
1 |
3 |
122,059 |
14.80% |
41.01% |
55.81% |
2.08% |
1.11% |
338,239 |
460,298 |
17,169 |
9,125 |
 | | Lt. Governor |
820,652 |
2 |
1 |
0 |
303,524 |
36.99% |
31.51% |
68.49% |
0.00% |
0.00% |
258,564 |
562,088 |
0 |
0 |
|