| Map | Pie | Year | Total | D | R | I | Margin | %Margin | Dem | Rep | Ind | Oth. | Dem | Rep | Ind | Other | | | | | | | | | | | | | | | | | | |
|---|
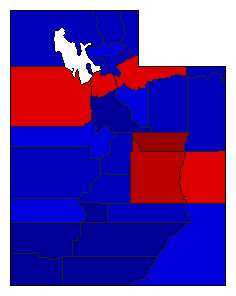
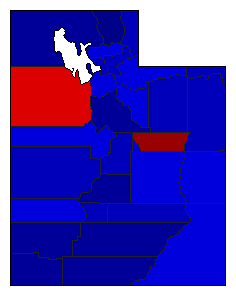
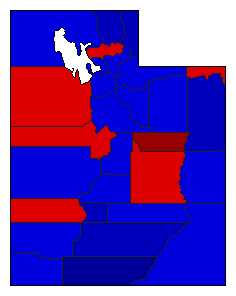
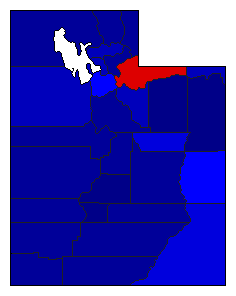 |  | 2016 |
1,074,992 |
2 |
1 |
3 |
350,050 |
32.56% |
30.66% |
63.23% |
6.11% |
0.00% |
329,625 |
679,675 |
65,692 |
0 |
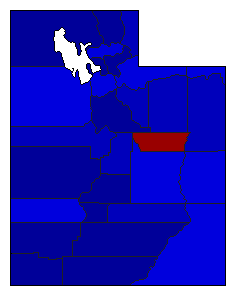
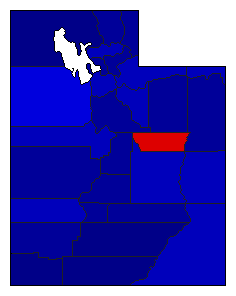
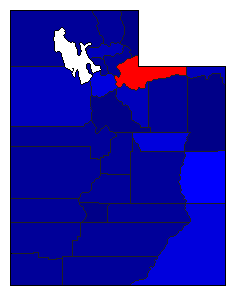 |  | 2012 |
969,100 |
2 |
1 |
3 |
350,135 |
36.13% |
29.33% |
65.46% |
5.21% |
0.00% |
284,238 |
634,373 |
50,489 |
0 |
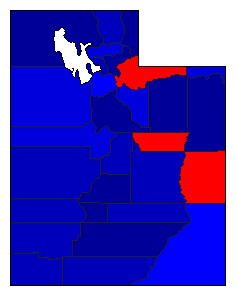 | | 2008 |
902,590 |
2 |
1 |
0 |
241,964 |
26.81% |
31.62% |
58.43% |
0.00% |
9.95% |
285,417 |
527,381 |
0 |
89,792 |
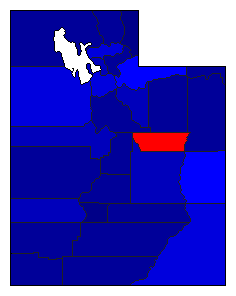 | | 2004 |
872,416 |
2 |
1 |
0 |
297,704 |
34.12% |
28.54% |
62.66% |
0.00% |
8.80% |
248,960 |
546,664 |
0 |
76,792 |
 | | 1996 |
631,337 |
2 |
1 |
0 |
101,545 |
16.08% |
41.96% |
58.04% |
0.00% |
0.00% |
264,896 |
366,441 |
0 |
0 |
 | | 1992 |
699,866 |
2 |
1 |
0 |
176,098 |
25.16% |
37.42% |
62.58% |
0.00% |
0.00% |
261,884 |
437,982 |
0 |
0 |
 | | 1988 |
594,447 |
2 |
1 |
0 |
140,033 |
23.56% |
38.22% |
61.78% |
0.00% |
0.00% |
227,207 |
367,240 |
0 |
0 |
 | | 1984 |
586,707 |
2 |
1 |
0 |
227,035 |
38.70% |
30.65% |
69.35% |
0.00% |
0.00% |
179,836 |
406,871 |
0 |
0 |
 | | 1960 |
367,485 |
2 |
1 |
0 |
9,859 |
2.68% |
48.66% |
51.34% |
0.00% |
0.00% |
178,813 |
188,672 |
0 |
0 |
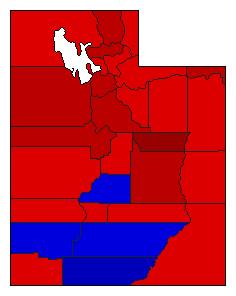 |  | 1940 |
246,421 |
1 |
2 |
0 |
63,503 |
25.77% |
62.89% |
37.11% |
0.00% |
0.00% |
154,962 |
91,459 |
0 |
0 |
|
